A study recently published in Communications Biology (Nature Portfolio) by Esra Oktay, Farhang Alem, Keziah Hernandez, Michael Girgis, Christopher Green, Divita Mathur, Igor L. Medintz, Aarthi Narayanan, and Rémí Veneziano introduces an innovative DNA origami–based nanovaccine platform targeting the receptor-binding domain (RBD) of SARS-CoV-2. Their findings highlight the potential of rationally engineered DNA nanoparticles to elicit strong and durable immune protection.
The researchers designed wireframe DNA origami nanoparticles (DNA-NPs) functionalized with ten trimerized RBD antigens and CpG oligonucleotides as adjuvants. Trimer assembly was achieved by peptide nucleic acid (PNA)–mediated conjugation of protein G to RBD-Fc, enabling precise orientation on DNA-NP overhangs. Biophysical characterization employed dynamic light scattering, Förster resonance energy transfer (FRET)–based stability assays, and quantitative fluorescence labeling. Structural confirmation was obtained via atomic force microscopy (AFM). For high-resolution AFM imaging, the team employed NanoWorld® USC-F0.3-k0.3 ultra-short cantilevers, chosen for their 300 kHz resonance frequency, ~0.3 N/m force constant, and <10 nm tip radius. These probes provided enhanced stability and resolution, enabling accurate nanoscale visualization of the vaccine constructs.
In murine models, the fully assembled RBD-DNA-NP with CpG provided complete protection following viral challenge. Vaccinated mice exhibited no weight loss or mortality, in stark contrast to control groups that received unconjugated components, bare origami scaffolds, or RBD alone—several of which experienced significant morbidity or mortality. Immunological assays revealed sustained neutralizing antibody activity two months post-immunization, with robust titers of RBD-specific IgG, IgM, and IgA, underscoring the durability of the immune response.
This work demonstrates that DNA origami nanostructures can serve as an adaptable and effective vaccine delivery platform. By integrating precise antigen display with adjuvant loading, the approach provides a promising blueprint for next-generation nanovaccines. The use of advanced AFM probes, such as the NanoWorld® USC-F0.3-k0.3, further underscores the importance of high-precision nanometrology tools in validating nanoscale biomedical designs.
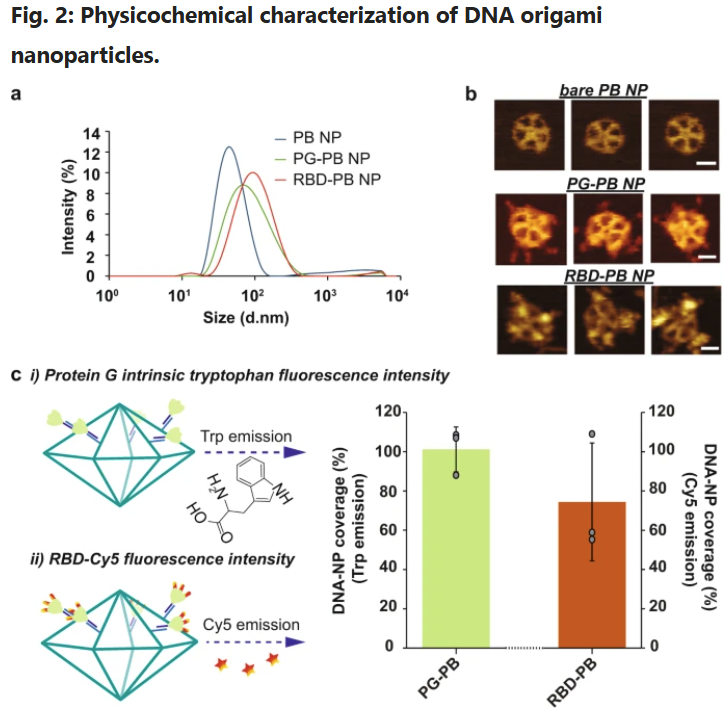
a Hydrodynamic diameter measurement of DNA-NPs with DLS. b Atomic force microscopy imaging of DNA-NPs formation and conjugation with 3-mer RBDs (scale bar: 20 nm). c Fluorescence-intensity based determination of PG and RBD stoichiometry on DNA origami NP. i) Tryptophan fluorescence emission was used to determine the total number of PG loaded on the surface of the DNA-NPs. ii) Second, the stoichiometry of RBD on NP was quantified via measuring the emission of Cy5 dyes conjugated to the RBD antigens. The bar graph represents the total coverage percentage for the PG (green bar) and the 3-mer RBD (orange bar) on the DNA-NP surface normalized to the number of conjugation sites available. Data are shown as the mean ± SD (n = 3 independent experiments).
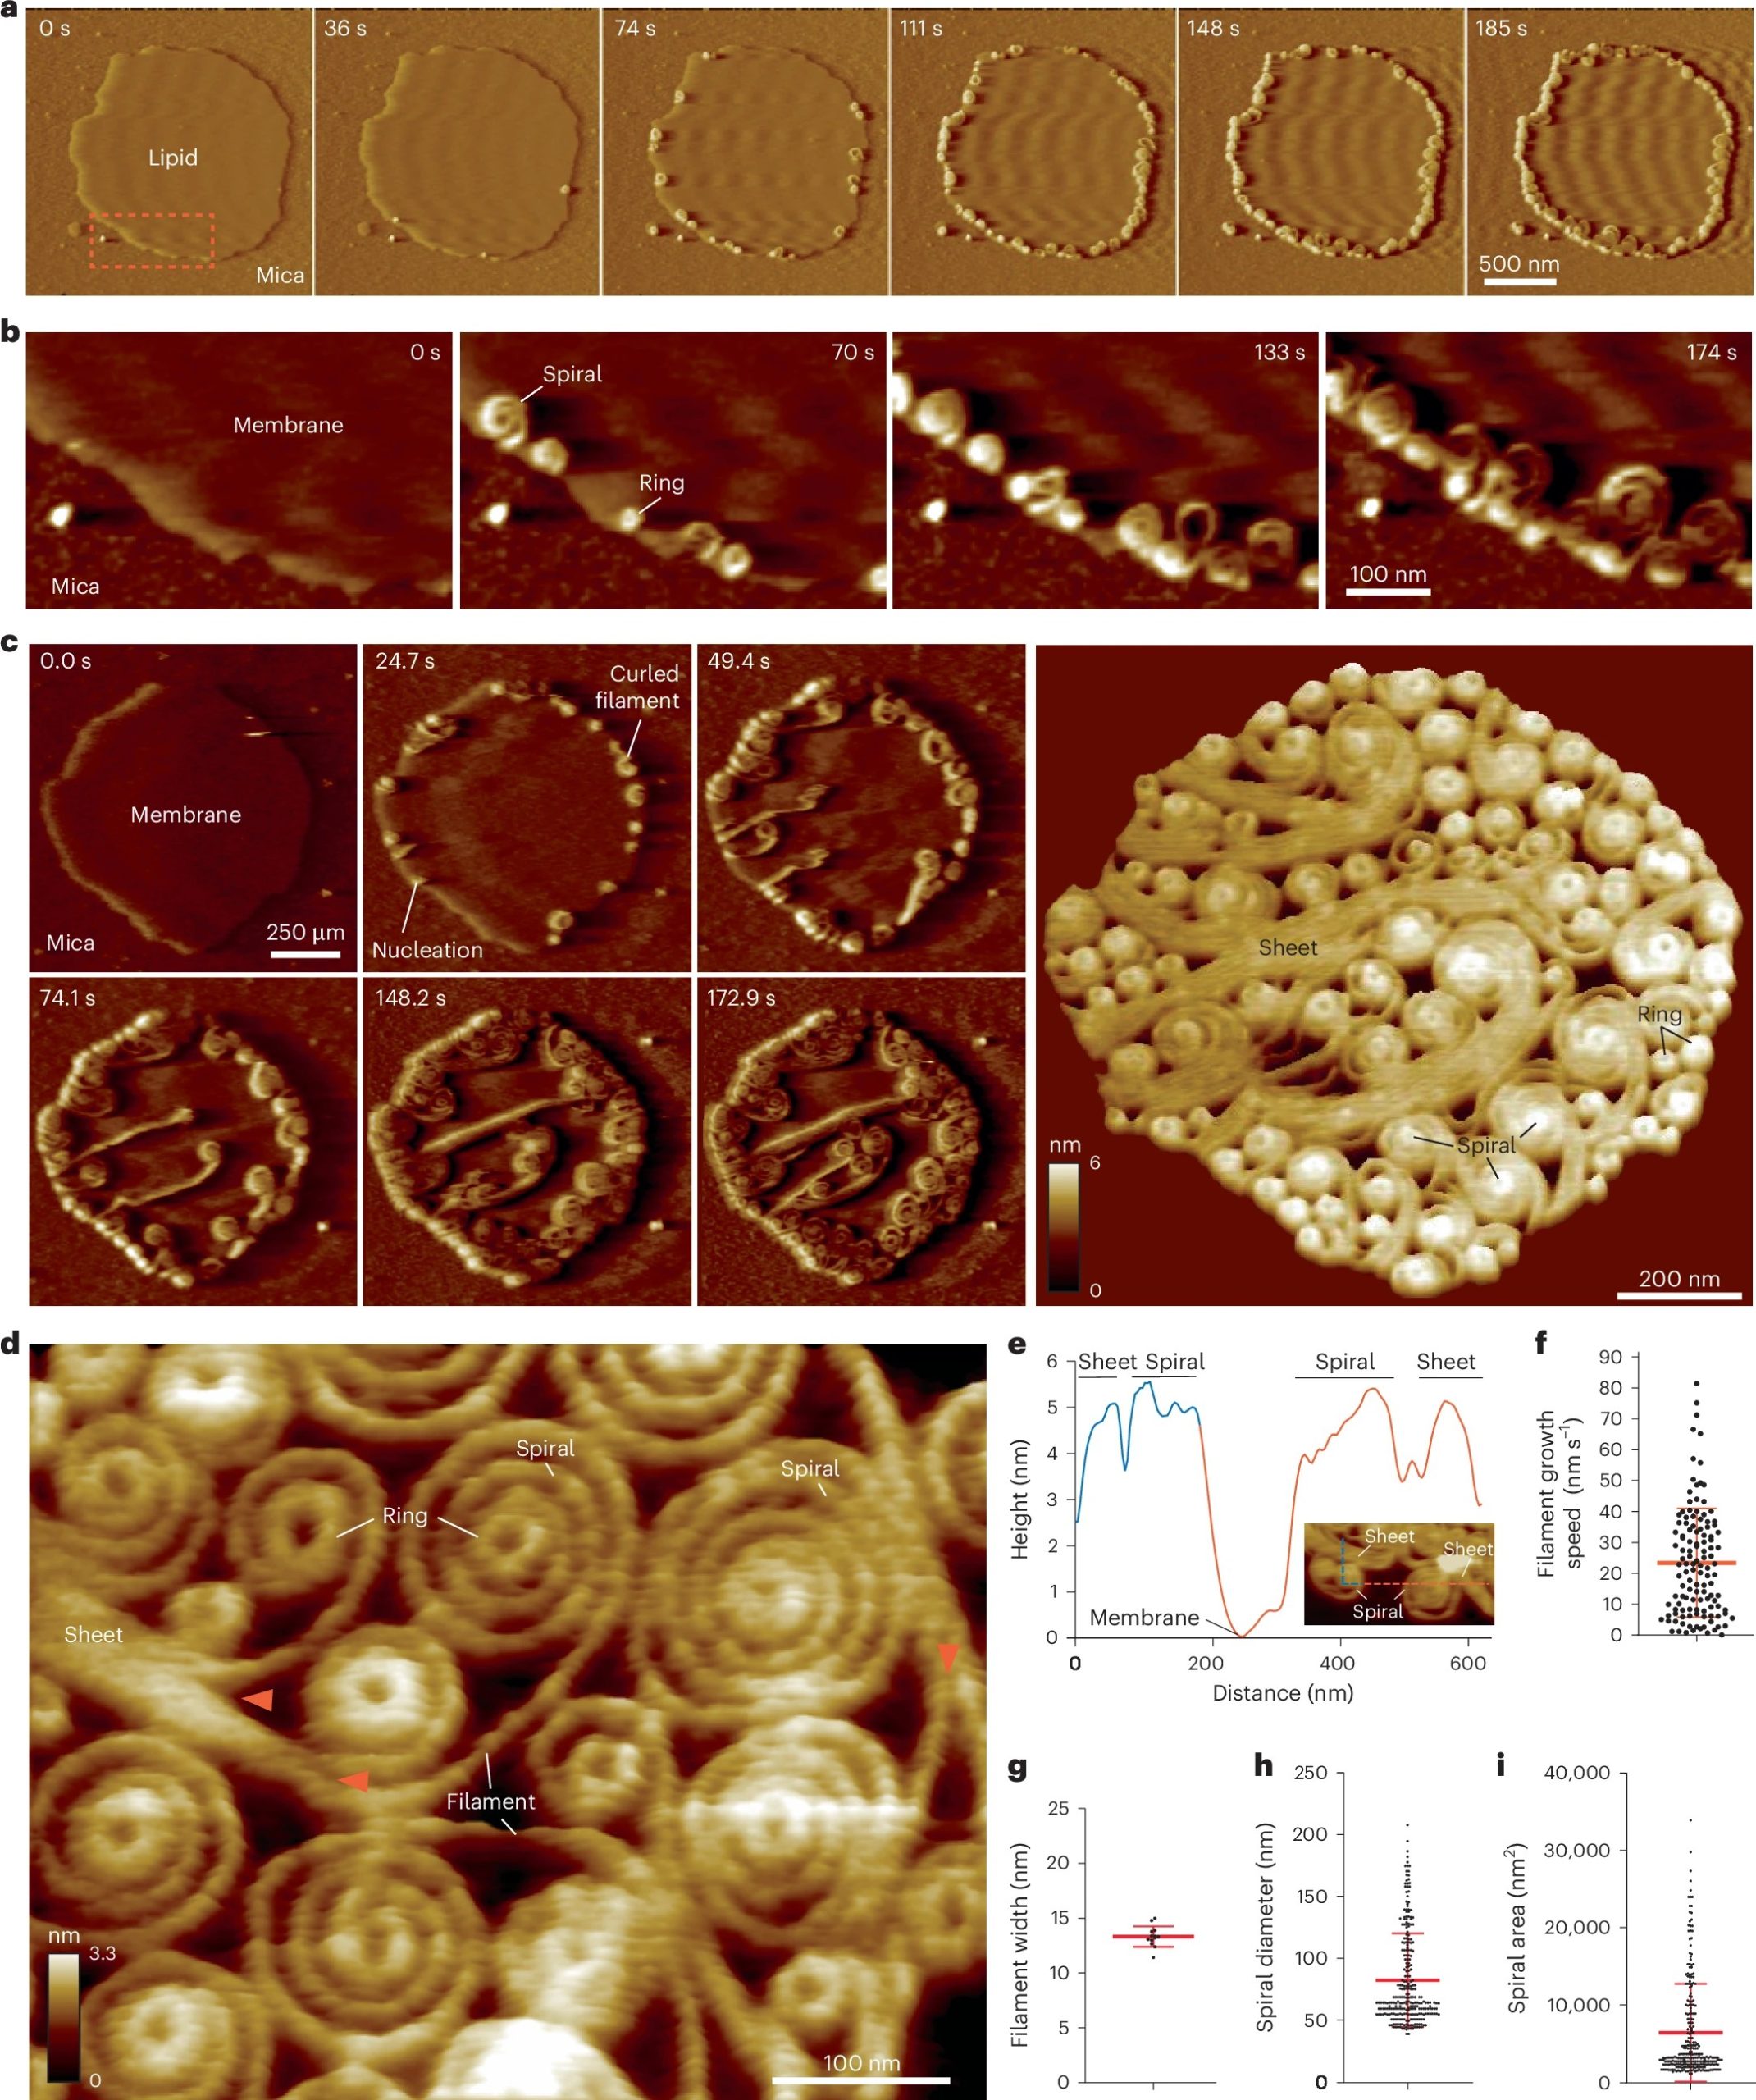
This article contains images reused from Jia et al., Nature Communications 14, 1394 (2023), licensed under CC BY 4.0.