High-speed AFM height spectroscopy reveals microsecond-dynamics of unlabeled biomolecules

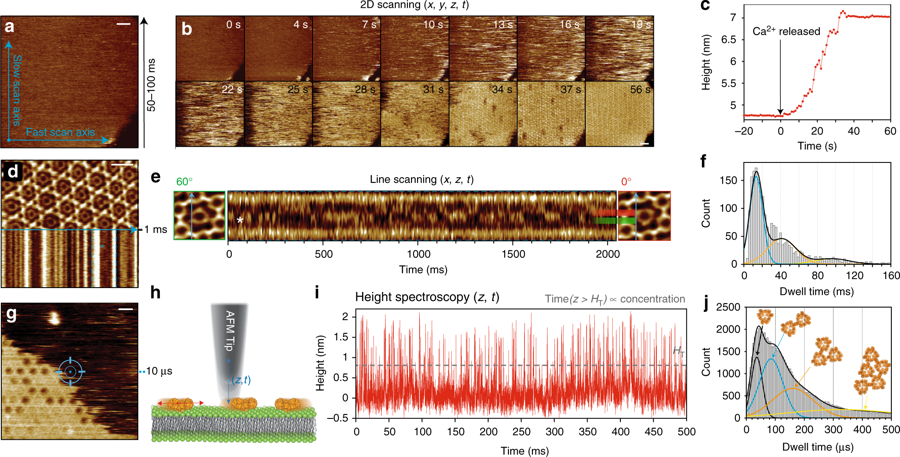
In their recent publication “High-speed AFM height spectroscopy reveals μs-dynamics of unlabeled biomolecules” in Nature Communications George R. Heath and Simon Sheuring develop and apply HS-AFM height spectroscopy (HS-AFM-HS, a technique inspired by fluorescence spectroscopy), a technique whereby the AFM tip is held at a fixed x–y position and  the height fluctuations under the tip in z-direction with Angstrom spatial and 10µs temporal resolution are monitored.

They demonstrate “how this technique can be used to simultaneously measure surface concentrations, diffusion rates and oligomer sizes of highly mobile annexin-V molecules during membrane-binding and self-assembly at model membranes and derive its kinetic and energetic terms. Additionally, HS-AFM-HS at specific positions in the annexin lattice where the freedom of movement is restricted to rotation allowed determination of the interaction free energies of protein-protein contacts.”* The applicability of this technique is wide and is discussed at the end of the publication.

NanoWorld Ultra-Short Cantilevers (USC) for Fast-/High-Speed AFM  ( USC-F1.2-k0.15 ) were used.

Congratulations to the authors to this publication which pushes the speed limits of AFM even further!

Increasing the temporal resolution of HS-AFM by reducing the dimensionality of data acquisition. a HS-AFM image of a DOPC/DOPS (8:2) membrane in the presence of annexin-V and NP-EGTA-caged Ca2+. Blue arrows illustrate the slow- (vertical) and the fast-scan axis (horizontal). Images can be captured at up to 10–20 frames s−1. b HS-AFM movie frames of A5 membrane-binding, self-assembly and formation of p6 2D-crystals upon UV-illumination induced Ca2+-release. c Average height/time trace of the membrane area in b. d Averaged HS-AFM image of an A5 p6-lattice overlaid with the subsequent line scanning kymograph, obtained by scanning repeatedly the central x-direction line as illustrated by the blue arrow with a maximum rate of 1000–2000 lines s−1. e Line scanning kymograph across one protomer of the non-p6 trimer, marked by * in d and e at a rate of 417 lines s−1 (2.4 ms per line). f Histogram of state dwell-times of the molecule in e. g HS-AFM image of an A5 p6-lattice partially covering a DOPC/DOPS (8:2) SLB surface during self-assembly. HS-AFM height spectroscopy (HS-AFM-HS) is performed following halting the x- and y-piezos to capture height information at a fixed position at the center of the image (illustrated by the target). h Schematic showing the principle of HS-AFM-HS. The AFM tip is oscillated in z at a fixed x,y-position, detecting single molecule dynamics such as diffusion under the tip. i Height/time trace obtained by HS-AFM-HS with the tip positioned at the center of image (g). The height/time trace allows determination of the local A5 concentration analyzing the time fraction of the occurrence of height peaks. j Dwell-time analysis of each height peak of diffusing A5 from 60 s height/time data and subsequent fitting of the distribution to multiple Gaussians (possible molecular aggregates corresponding to the fits with distinct dwell-times (τD) are shown above the graph). All scale bars: 20 nm, NanoWorld Ultra-Short Cantilevers (USC) for Fast-/High-Speed AFM ( USC-F1.2-k0.15 ) were used.
Figure 1 from “High-speed AFM height spectroscopy reveals μs-dynamics of unlabeled biomolecules”: Increasing the temporal resolution of HS-AFM by reducing the dimensionality of data acquisition. a HS-AFM image of a DOPC/DOPS (8:2) membrane in the presence of annexin-V and NP-EGTA-caged Ca2+. Blue arrows illustrate the slow- (vertical) and the fast-scan axis (horizontal). Images can be captured at up to 10–20 frames s−1. b HS-AFM movie frames of A5 membrane-binding, self-assembly and formation of p6 2D-crystals upon UV-illumination induced Ca2+-release. c Average height/time trace of the membrane area in b. d Averaged HS-AFM image of an A5 p6-lattice overlaid with the subsequent line scanning kymograph, obtained by scanning repeatedly the central x-direction line as illustrated by the blue arrow with a maximum rate of 1000–2000 lines s−1. e Line scanning kymograph across one protomer of the non-p6 trimer, marked by * in d and e at a rate of 417 lines s−1 (2.4 ms per line). f Histogram of state dwell-times of the molecule in e. g HS-AFM image of an A5 p6-lattice partially covering a DOPC/DOPS (8:2) SLB surface during self-assembly. HS-AFM height spectroscopy (HS-AFM-HS) is performed following halting the x- and y-piezos to capture height information at a fixed position at the center of the image (illustrated by the target). h Schematic showing the principle of HS-AFM-HS. The AFM tip is oscillated in z at a fixed x,y-position, detecting single molecule dynamics such as diffusion under the tip. i Height/time trace obtained by HS-AFM-HS with the tip positioned at the center of image (g). The height/time trace allows determination of the local A5 concentration analyzing the time fraction of the occurrence of height peaks. j Dwell-time analysis of each height peak of diffusing A5 from 60 s height/time data and subsequent fitting of the distribution to multiple Gaussians (possible molecular aggregates corresponding to the fits with distinct dwell-times (τD) are shown above the graph). All scale bars: 20 nm

*George R. Heath & Simon Scheuring
High-speed AFM height spectroscopy reveals μs-dynamics of unlabeled biomolecules
Nature Communicationsvolume 9, Article number: 4983 (2018)
DOI: https://doi.org/10.1038/s41467-018-07512-3

Please follow this external link for the full article: https://rdcu.be/bdaKU

Open Access The article “High-speed AFM height spectroscopy reveals μ s-dynamics of unlabeled biomolecules” by George R. Heath & Simon Scheuring is licensed under a Creative Commons Attribution 4.0 International License, which permits use, sharing, adaptation, distribution and reproduction in any medium or format, as long as you give appropriate credit to the original author(s) and the source, provide a link to the Creative Commons license, and indicate if changes were made. The images or other third party material in this article are included in the article’s Creative Commons license, unless indicated otherwise in a credit line to the material. If material is not included in the article’s Creative Commons license and your intended use is not permitted by statutory regulation or exceeds the permitted use, you will need to obtain permission directly from the copyright holder. To view a copy of this license, visit http://creativecommons.org/licenses/by/4.0/.

AFM probes for Magnetic Force Microscopy – screencast on NanoWorld MFM tips passes 1000 views mark

The screencast about NanoWorld AFM probes for Magnetic Force Microscopy held by Dr. Marco Becker has just passed the 1000 views mark. Congratulations Marco!

NanoWorld offers two types of MFM tips:

MFMR – This type of magnetic AFM tip is coated with a hard magnetic coating on the tip side and yields a very high force sensitivity, while simultaneously enabling tapping and lift mode operation.

S-MFMR – These magnetic  AFM tips are coated with a soft magnetic layer on the tip side and are designed for the measurement of magnetic domains in soft magnetic samples.