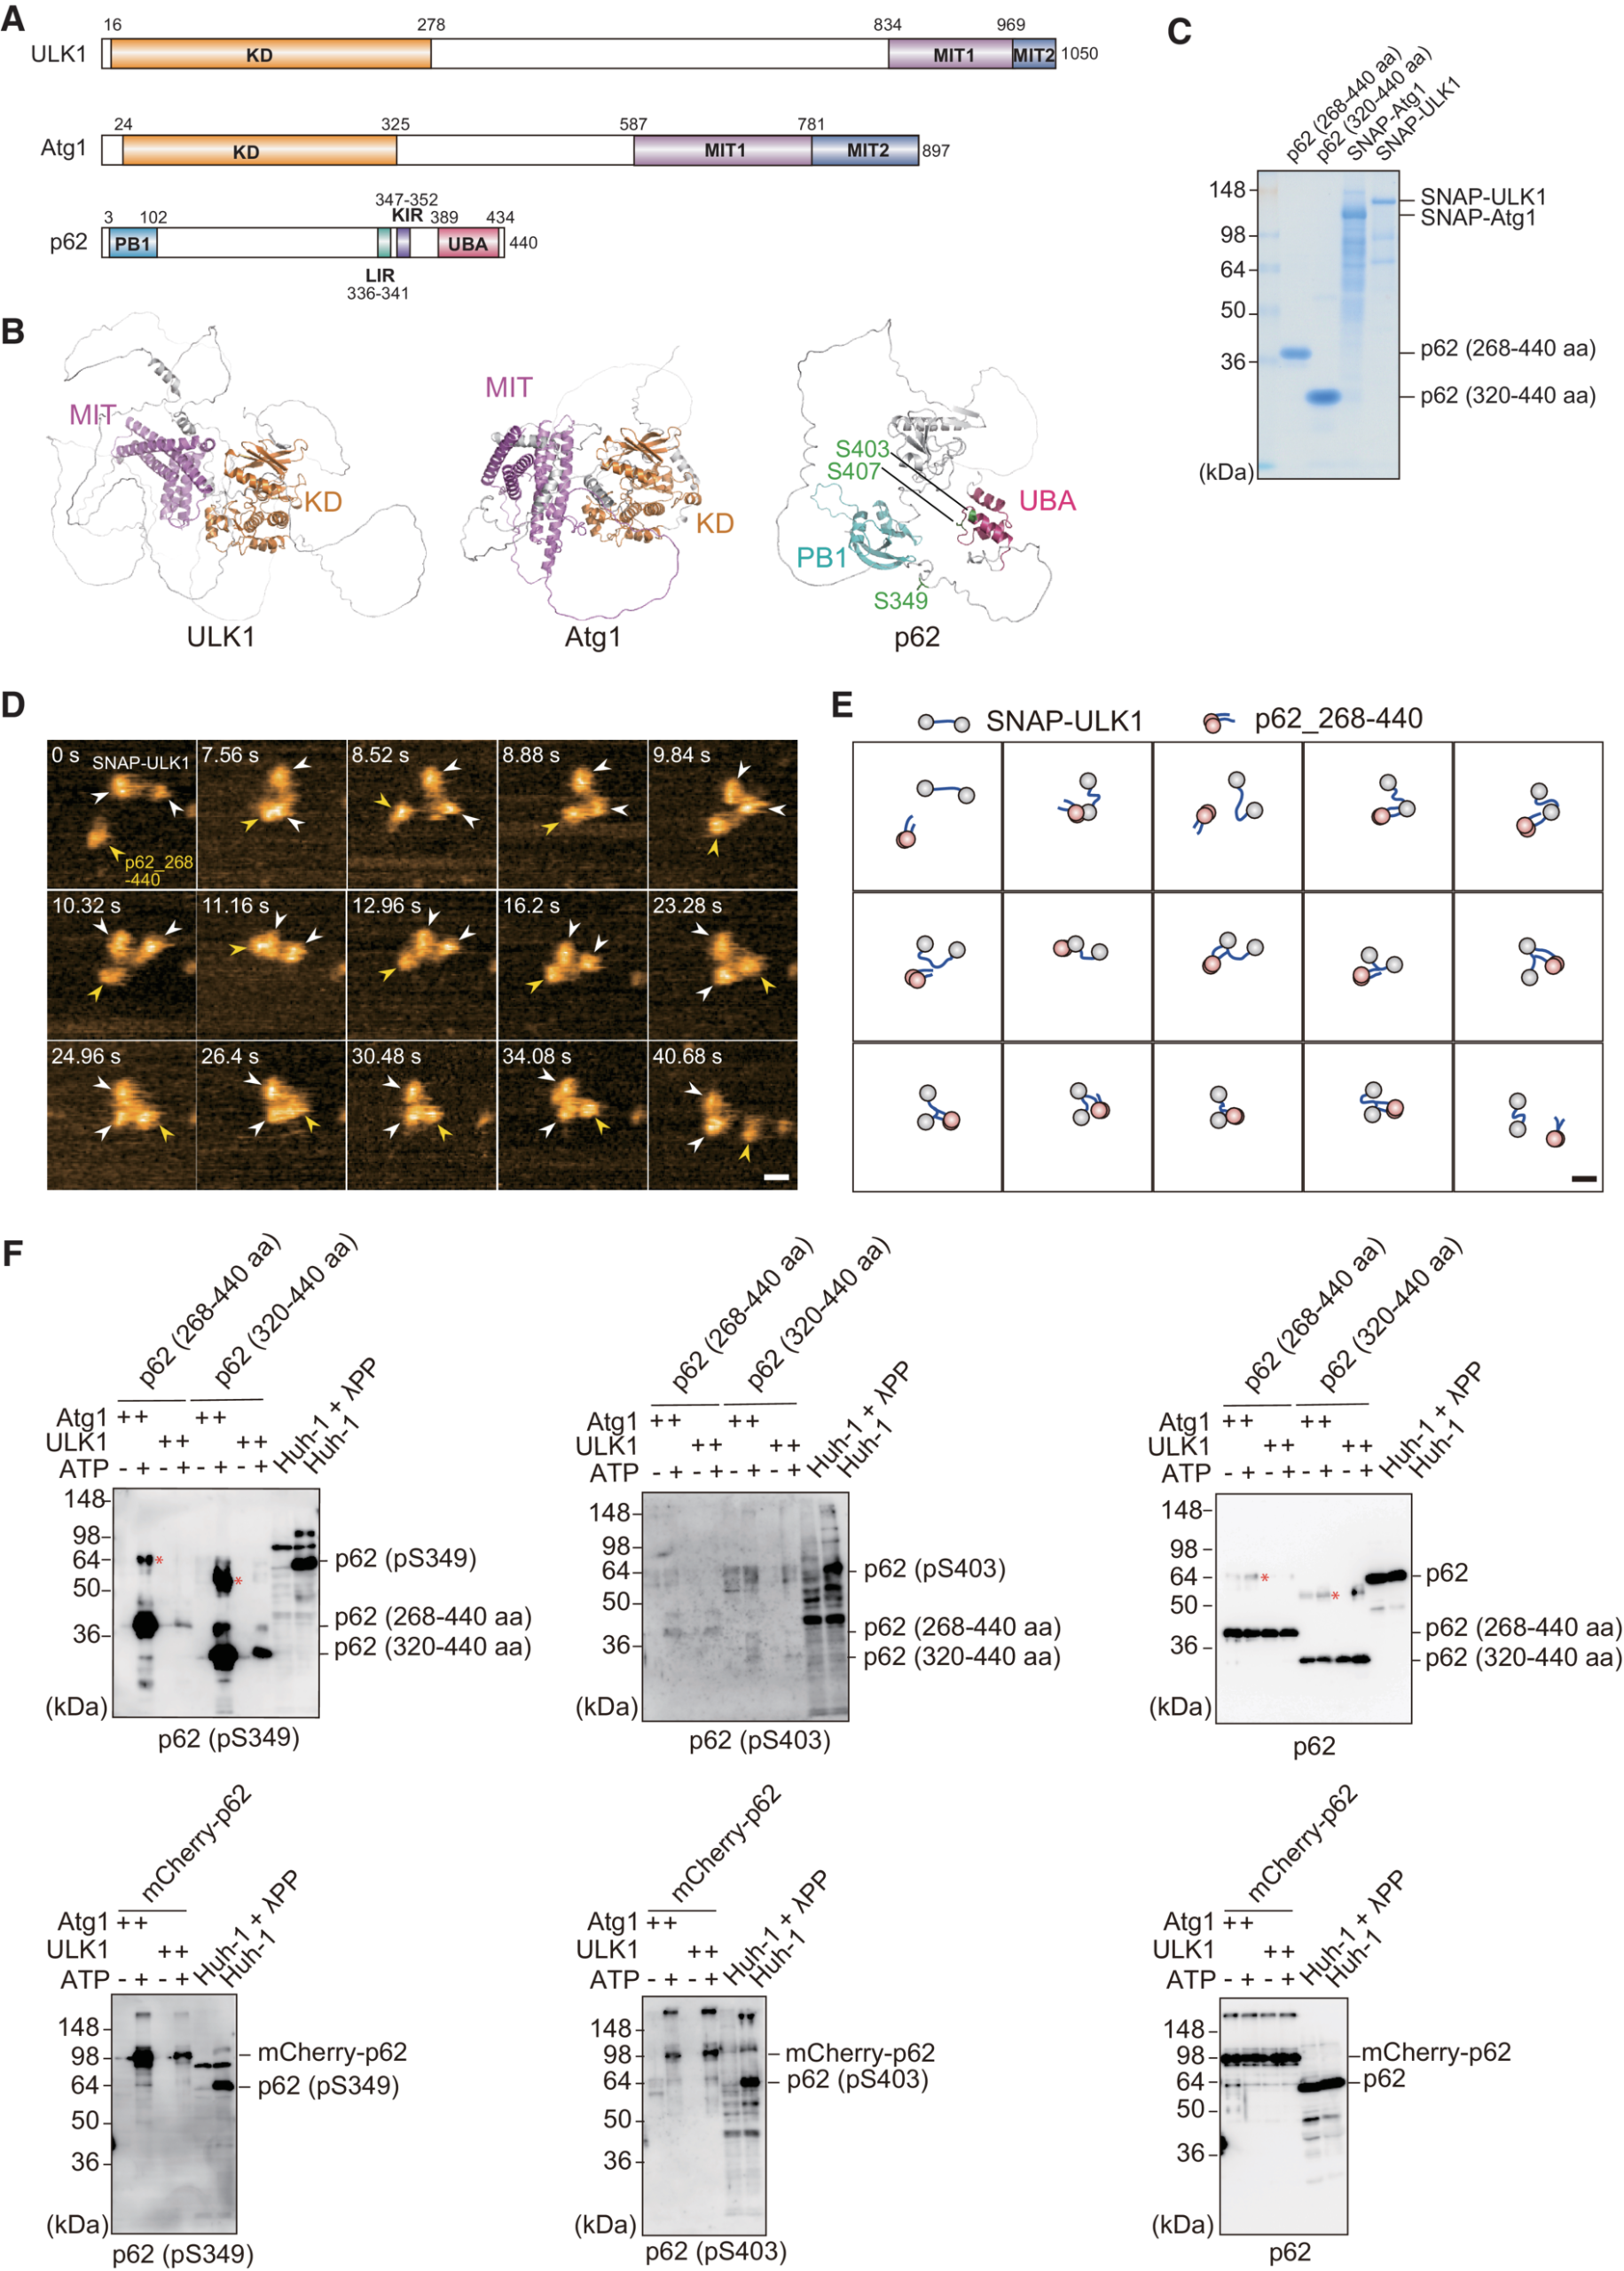
The article “Phosphorylation of phase-separated p62 bodies by ULK1 activates a redox-independent stress response” by Yasuhiro Fujioka, Yuko Noda, Atsushi Noda, Yukari Yamasaki, Rika Hayakawa, Kazuaki Okada, Takeshi Iwatsubo, Yoshinori Watanabe, and Nobuo N. Noda is a landmark contribution to molecular biology. Their work uncovers a novel redox-independent mechanism for NRF2 activation through ULK1-mediated phosphorylation of p62 at Ser349—a discovery that reshapes our understanding of cellular stress responses.
What sets this study apart is its exquisite use of high-speed atomic force microscopy (HS-AFM), where the NanoWorld USC‑F1.2‑k0.15 ultra-short cantilever was instrumental (https://www.nanoworld.com/Ultra-Short-Cantilevers-USC-F1.2-k0.15) . With its ultra-fast response and high-resolution capability, this probe enabled real-time visualization of dynamic molecular interactions at the nanoscale. The combination of biochemical rigor and nanotechnological precision allowed the team to capture critical conformational shifts in p62 and ULK1, validating their proposed mechanism with striking clarity.
The authors’ multidisciplinary approach, combining structural biology, live-cell imaging, and biophysics, is a masterclass in scientific innovation. This study not only deepens our knowledge of autophagy and stress signaling but also showcases how the right tools—like the USC‑F1.2‑k0.15—can push the boundaries of discovery.
EMBO J(2023)42: e113349 https://doi.org/10.15252/embj.2022113349
Bacterial cell division is a complex process requiring the coordination of multiple components to allow the appropriate spatial and temporal control of septum formation and cell scission. *
Peptidoglycan (PG) is the major structural component of the septum, and recent studies by Katarzyna Wacnik et al., in the human pathogen Staphylococcus aureus have revealed a complex, multistage PG architecture that develops during septation. *
Penicillin-binding proteins (PBPs) are essential for the final steps of PG biosynthesis; their transpeptidase activity links the peptide side chains of nascent glycan strands. PBP1 is required for cell division in S. aureus. *
In the article “Penicillin-Binding Protein 1 (PBP1) of Staphylococcus aureus Has Multiple Essential Functions in Cell Division” Katarzyna Wacnik, Vincenzo A. Rao, Xinyue Chen, Lucia Lafage, Manuel Pazos, Simon Booth, Waldemar Vollmer, Jamie K. Hobbs, Richard J. Lewis and Simon J. Foster demonstrate that it has multiple essential functions associated with its enzymatic activity and as a regulator of division. *
Loss of PBP1, or just its C-terminal PASTA domains, results in cessation of division at the point of septal plate formation. The PASTA domains can bind PG and thereby potentially coordinate the cell division process. The transpeptidase activity of PBP1 is also essential, but its loss leads to a strikingly different phenotype of thickened and aberrant septa, which is phenocopied by the morphological effects of adding the PBP1-specific β-lactam, meropenem. Together, these results lead to a model for septal PG synthesis where PBP1 enzyme activity is required for the characteristic architecture of the septum and PBP1 protein molecules enable the formation of the septal plate. *
Bacterial cell wall peptidoglycan is essential, and its synthesis is the target of clinically important antibiotics such as β-lactams. β-lactams target penicillin-binding proteins (PBPs) that assemble new peptidoglycan from its building blocks. *
The human pathogen Staphylococcus aureus only has two essential PBPs that can carry out all the functions necessary for growth and division. *
In the absence of the confounding antibiotic resistance-associated PBP PBP2A, the PBP1 transpeptidase activity is required for cell division, and in the article “Penicillin-Binding Protein 1 (PBP1) of Staphylococcus aureus Has Multiple Essential Functions in Cell Division”, Katarzyna Wacnik et al. state that they have found that it has several essential functions, both as an enzyme and as a coordinator by binding to cell division proteins and to its peptidoglycan product, via its PASTA domains. *
This has led to a new model for cell division with PBP1 responsible for the synthesis of the characteristic architectural features of the septum. *
NanoWorld Ultra-Short Cantilevers for High-Speed AFM of the USC-F0.3-k0.3 AFM probe type (nominal spring constant of 0.3 N/m and resonant frequency (in liquid) of ~150 kHz (300 kHz in air) were used for the Atomic Force Microscopy imaging.
Supplemental Material from Katarzyna Wacnik et al 2022 “Penicillin-Binding Protein 1 (PBP1) of Staphylococcus aureus Has Multiple Essential Functions in Cell Division” FIG S5: Gallery of AFM images of S. aureus Δpbp1, pbp1ΔPASTA, and pbp1*. (A) Diagram of the section through of the cell with progressing septum (top) and AFM topographic images (bottom) of unfinished (i) and closed (ii) septa, parallel to the plane of the image, in SH1000 WT. Sacculi (images to the left, scale bars = 500 nm, data scales [z]: 200 [top] and 250 nm [bottom]) and higher-magnification scans (images to the right, scale bars = 50 nm, data scales [z]: 80 [top] and 40 nm [bottom]) of the boxed areas from the images to the left. (B) AFM topographic images of unfinished septa, parallel to the plane of the image, in Δpbp1 (from left to right, scale bars = 500, 50, and 50 nm; data scales [z] 500, 120, and 150 nm), pbp1ΔPASTA (from left to right, scale bars = 500, 50, and 50 nm; data scales [z] 693, 80, and 100 nm), and pbp1* (from left to right, scale bars = 500, 50, and 50 nm; data scales [z] 500, 80, and 25 nm) grown in the absence of inducer for 2 h. Images to the left are sacculi, while images in the center (1) and to the right (2) are higher-magnification scans of the boxed areas of the images on the left. (C) AFM topographic images (right) of the external nascent ring architecture in SH1000 WT (wt; from top to bottom, scale bars = 500 and 50 nm; data scales [z], 100 and 20 nm) and mutants Δpbp1 (top to bottom, scale bars = 500 and 50 nm; data scales [z], 400 and 60 nm) and pbp1ΔPASTA (from top to bottom, scale bars = 500 and 50 nm; data scales [z], 350 and 100 nm) grown in the absence of inducer for 2 h. The top images are the external surface of sacculi, while the bottom images are higher-magnification scans of the boxed areas of the top images. The arrows indicate piecrusts of the next division plane, which dissects the previous division septum. Arrowheads indicate abnormal features, holes, in the PG ring architecture. On the left is an interpretive diagram of a section through the cell wall (i) and the corresponding external surface (ii) as viewed by AFM. The mature cell wall of a newly separated daughter cell is shown in blue, which has both internally and externally mesh-structured PG. The newly exposed septum has an external ring-structured PG (green) and a mesh-like cytoplasmic facing PG (yellow). Data are representative of two independent experiments.*Katarzyna Wacnik, Vincenzo A. Rao, Xinyue Chen, Lucia Lafage, Manuel Pazos, Simon Booth, Waldemar Vollmer, Jamie K. Hobbs, Richard J. Lewis and Simon J. Foster Penicillin-Binding Protein 1 (PBP1) of Staphylococcus aureus Has Multiple Essential Functions in Cell Division
American Society for Microbiology Journals, (2022) mBio, Vol. 13, No. 4
DOI: https://doi.org/10.1128/mbio.00669-22
The article “Penicillin-Binding Protein 1 (PBP1) of Staphylococcus aureus Has Multiple Essential Functions in Cell Division” by Katarzyna Wacnik, Vincenzo A. Rao, Xinyue Chen, Lucia Lafage, Manuel Pazos, Simon Booth, Waldemar Vollmer, Jamie K. Hobbs, Richard J. Lewis and Simon J. Foster is licensed under a Creative Commons Attribution 4.0 International License, which permits use, sharing, adaptation, distribution and reproduction in any medium or format, as long as you give appropriate credit to the original author(s) and the source, provide a link to the Creative Commons license, and indicate if changes were made. The images or other third-party material in this article are included in the article’s Creative Commons license, unless indicated otherwise in a credit line to the material. If material is not included in the article’s Creative Commons license and your intended use is not permitted by statutory regulation or exceeds the permitted use, you will need to obtain permission directly from the copyright holder. To view a copy of this license, visit https://creativecommons.org/licenses/by/4.0/.
The behaviour of ions at solid–liquid interfaces underpins countless phenomena, from the conduction of nervous impulses to charge transfer in solar cells. In most cases, ions do not operate as isolated entities, but in conjunction with neighbouring ions and the surrounding solution. In aqueous solutions, recent studies suggest the existence of group dynamics through water-mediated clusters but results allowing direct tracking of ionic domains with atomic precision are scarce. *
Atomic force microscopy (AFM) can image single ions adsorbed at various solid–liquid interfaces. One of the main advantages of the technique is its ability to probe individual ions in-situ but with local contextual information about the interface over tens of nanometres at the point of measurement.*
High-speed atomic force microscopy (HS-AFM) operates similarly to standard AFM but with enhanced temporal resolution and can capture images at video rate, making it possible to track many molecular processes in real-time.*
In the article “Real-time tracking of ionic nano-domains under shear flow” Clodomiro Cafolla and Kislon Voïtchovsky use high-speed atomic force microscopy to track the evolution of Rb+, K+, Na+ and Ca2+ nano-domains containing 20 to 120 ions adsorbed at the surface of mica in aqueous solution. The interface is exposed to a shear flow able to influence the lateral motion of single ions and clusters. *
They report the achievement of single-ion spatial resolution with ~ 2 s temporal resolution.*
During the measurements, the AFM cantilever and the sample were fully immersed in the aqueous ionic solution of interest. The AFM probes used were NanoWorld Arrow-UHF ultra-high frequency AFM cantilevers. *
The results presented in the article provide some quantitative insights into the relationship between single ion properties and group dynamics at the solid–liquid interface in the presence of a microscale shear flow, with potential technological applications from manufacturing biomedical devices to enhancing the performance of aqueous ion-batteries.*
Figure 1 from “Real-time tracking of ionic nano-domains under shear flow” by Clodomiro Cafolla and Kislon Voïtchovsky: Example of time evolution for adsorbed Rb+ ions at the mica-water interface in the presence of a shear flow. (a) A time-lapse sequence shows consecutive high-resolution HS-AFM topographical images of Rb+ ions at the interface between mica and a 5 mM RbCl aqueous solution. Rb+ ions appear as bright orange-yellow protrusions standing taller than the mica surface (purple-black). Periodic rows and larger domains are clearly visible as well as singly adsorbed rubidium ions. (b) Representative image analysis highlighting Rb+ ions as orange markers (obtained by thresholding) and the idealised underlying lattice derived by inverse Fourier transform of the filtered power spectrum in each image of (a) (see ESI Section 3 for details on the procedure). (c) The algorithm automatically associates neighbouring ions (within distances < 0.52 nm) to the same cluster. Domains smaller than 5 ions are discarded here. The different clusters derived in each image are highlighted using different colours, keeping for each cluster the same colour over time. The cyan-coloured cluster offers a good example of temporal evolution. The scale bars in (a–c) represent 3 nm and the z-scale in (a) corresponds to 0.8 nm.
*Clodomiro Cafolla and Kislon Voïtchovsky Real-time tracking of ionic nano-domains under shear flow
Nature Scientific Reports volume 11, Article number: 19540 (2021)
DOI: https://doi.org/10.1038/s41598-021-98137-y
Open Access The article “Real-time tracking of ionic nano-domains under shear flow” by Clodomiro Cafolla and Kislon Voïtchovsky is licensed under a Creative Commons Attribution 4.0 International License, which permits use, sharing, adaptation, distribution and reproduction in any medium or format, as long as you give appropriate credit to the original author(s) and the source, provide a link to the Creative Commons license, and indicate if changes were made. The images or other third party material in this article are included in the article’s Creative Commons license, unless indicated otherwise in a credit line to the material. If material is not included in the article’s Creative Commons license and your intended use is not permitted by statutory regulation or exceeds the permitted use, you will need to obtain permission directly from the copyright holder. To view a copy of this license, visit http://creativecommons.org/licenses/by/4.0/.
![Supplemental Material from Katarzyna Wacnik et al 2022 “Penicillin-Binding Protein 1 (PBP1) of Staphylococcus aureus Has Multiple Essential Functions in Cell Division” FIG S5: Gallery of AFM images of S. aureus Δpbp1, pbp1ΔPASTA, and pbp1*. (A) Diagram of the section through of the cell with progressing septum (top) and AFM topographic images (bottom) of unfinished (i) and closed (ii) septa, parallel to the plane of the image, in SH1000 WT. Sacculi (images to the left, scale bars = 500 nm, data scales [z]: 200 [top] and 250 nm [bottom]) and higher-magnification scans (images to the right, scale bars = 50 nm, data scales [z]: 80 [top] and 40 nm [bottom]) of the boxed areas from the images to the left. (B) AFM topographic images of unfinished septa, parallel to the plane of the image, in Δpbp1 (from left to right, scale bars = 500, 50, and 50 nm; data scales [z] 500, 120, and 150 nm), pbp1ΔPASTA (from left to right, scale bars = 500, 50, and 50 nm; data scales [z] 693, 80, and 100 nm), and pbp1* (from left to right, scale bars = 500, 50, and 50 nm; data scales [z] 500, 80, and 25 nm) grown in the absence of inducer for 2 h. Images to the left are sacculi, while images in the center (1) and to the right (2) are higher-magnification scans of the boxed areas of the images on the left. (C) AFM topographic images (right) of the external nascent ring architecture in SH1000 WT (wt; from top to bottom, scale bars = 500 and 50 nm; data scales [z], 100 and 20 nm) and mutants Δpbp1 (top to bottom, scale bars = 500 and 50 nm; data scales [z], 400 and 60 nm) and pbp1ΔPASTA (from top to bottom, scale bars = 500 and 50 nm; data scales [z], 350 and 100 nm) grown in the absence of inducer for 2 h. The top images are the external surface of sacculi, while the bottom images are higher-magnification scans of the boxed areas of the top images. The arrows indicate piecrusts of the next division plane, which dissects the previous division septum. Arrowheads indicate abnormal features, holes, in the PG ring architecture. On the left is an interpretive diagram of a section through the cell wall (i) and the corresponding external surface (ii) as viewed by AFM. The mature cell wall of a newly separated daughter cell is shown in blue, which has both internally and externally mesh-structured PG. The newly exposed septum has an external ring-structured PG (green) and a mesh-like cytoplasmic facing PG (yellow). Data are representative of two independent experiments. NanoWorld Ultra-Short Cantilevers for High-Speed Atomic Force Microscopy of the USC-F0.3-k0.3 AFM probe type were used.](https://dhipgo7nn2tea.cloudfront.net/wp-content/uploads/2023/05/31102216/Supplemental-Material-from-KWacnik-et-al-2022-Penicillin-Binding-Protein-1-PBP1-of-Staphylococcus-aureus-Has-Multiple-Essential-Functions-in-Cell-Division-FIG-S5-USC-F0_3-k0_3-AFM-probe.jpg)