The ESCRT-III-like protein Vipp1 couples filament polymerization with membrane remodeling. It assembles planar sheets as well as 3D rings and helical polymers, all implicated in mitigating plastid-associated membrane stress. The architecture of Vipp1 planar sheets and helical polymers remains unknown, as do the geometric changes required to transition between polymeric forms. *
In the article “Mechanism for Vipp1 spiral formation, ring biogenesis, and membrane repair” Souvik Naskar, Andrea Merino, Javier Espadas, Jayanti Singh, Aurelien Roux, Adai Colom and Harry H. Low show how cyanobacterial Vipp1 assembles into morphologically-related sheets and spirals on membranes in vitro.*
The spirals converge to form a central ring similar to those described in membrane budding. Cryo-EM structures of helical filaments reveal a close geometric relationship between Vipp1 helical and planar lattices. Moreover, the helical structures reveal how filaments twist—a process required for Vipp1, and likely other ESCRT-III filaments, to transition between planar and 3D architectures. *
Overall, the authors’ results provide a molecular model for Vipp1 ring biogenesis and a mechanism for Vipp1 membrane stabilization and repair, with implications for other ESCRT-III systems. *
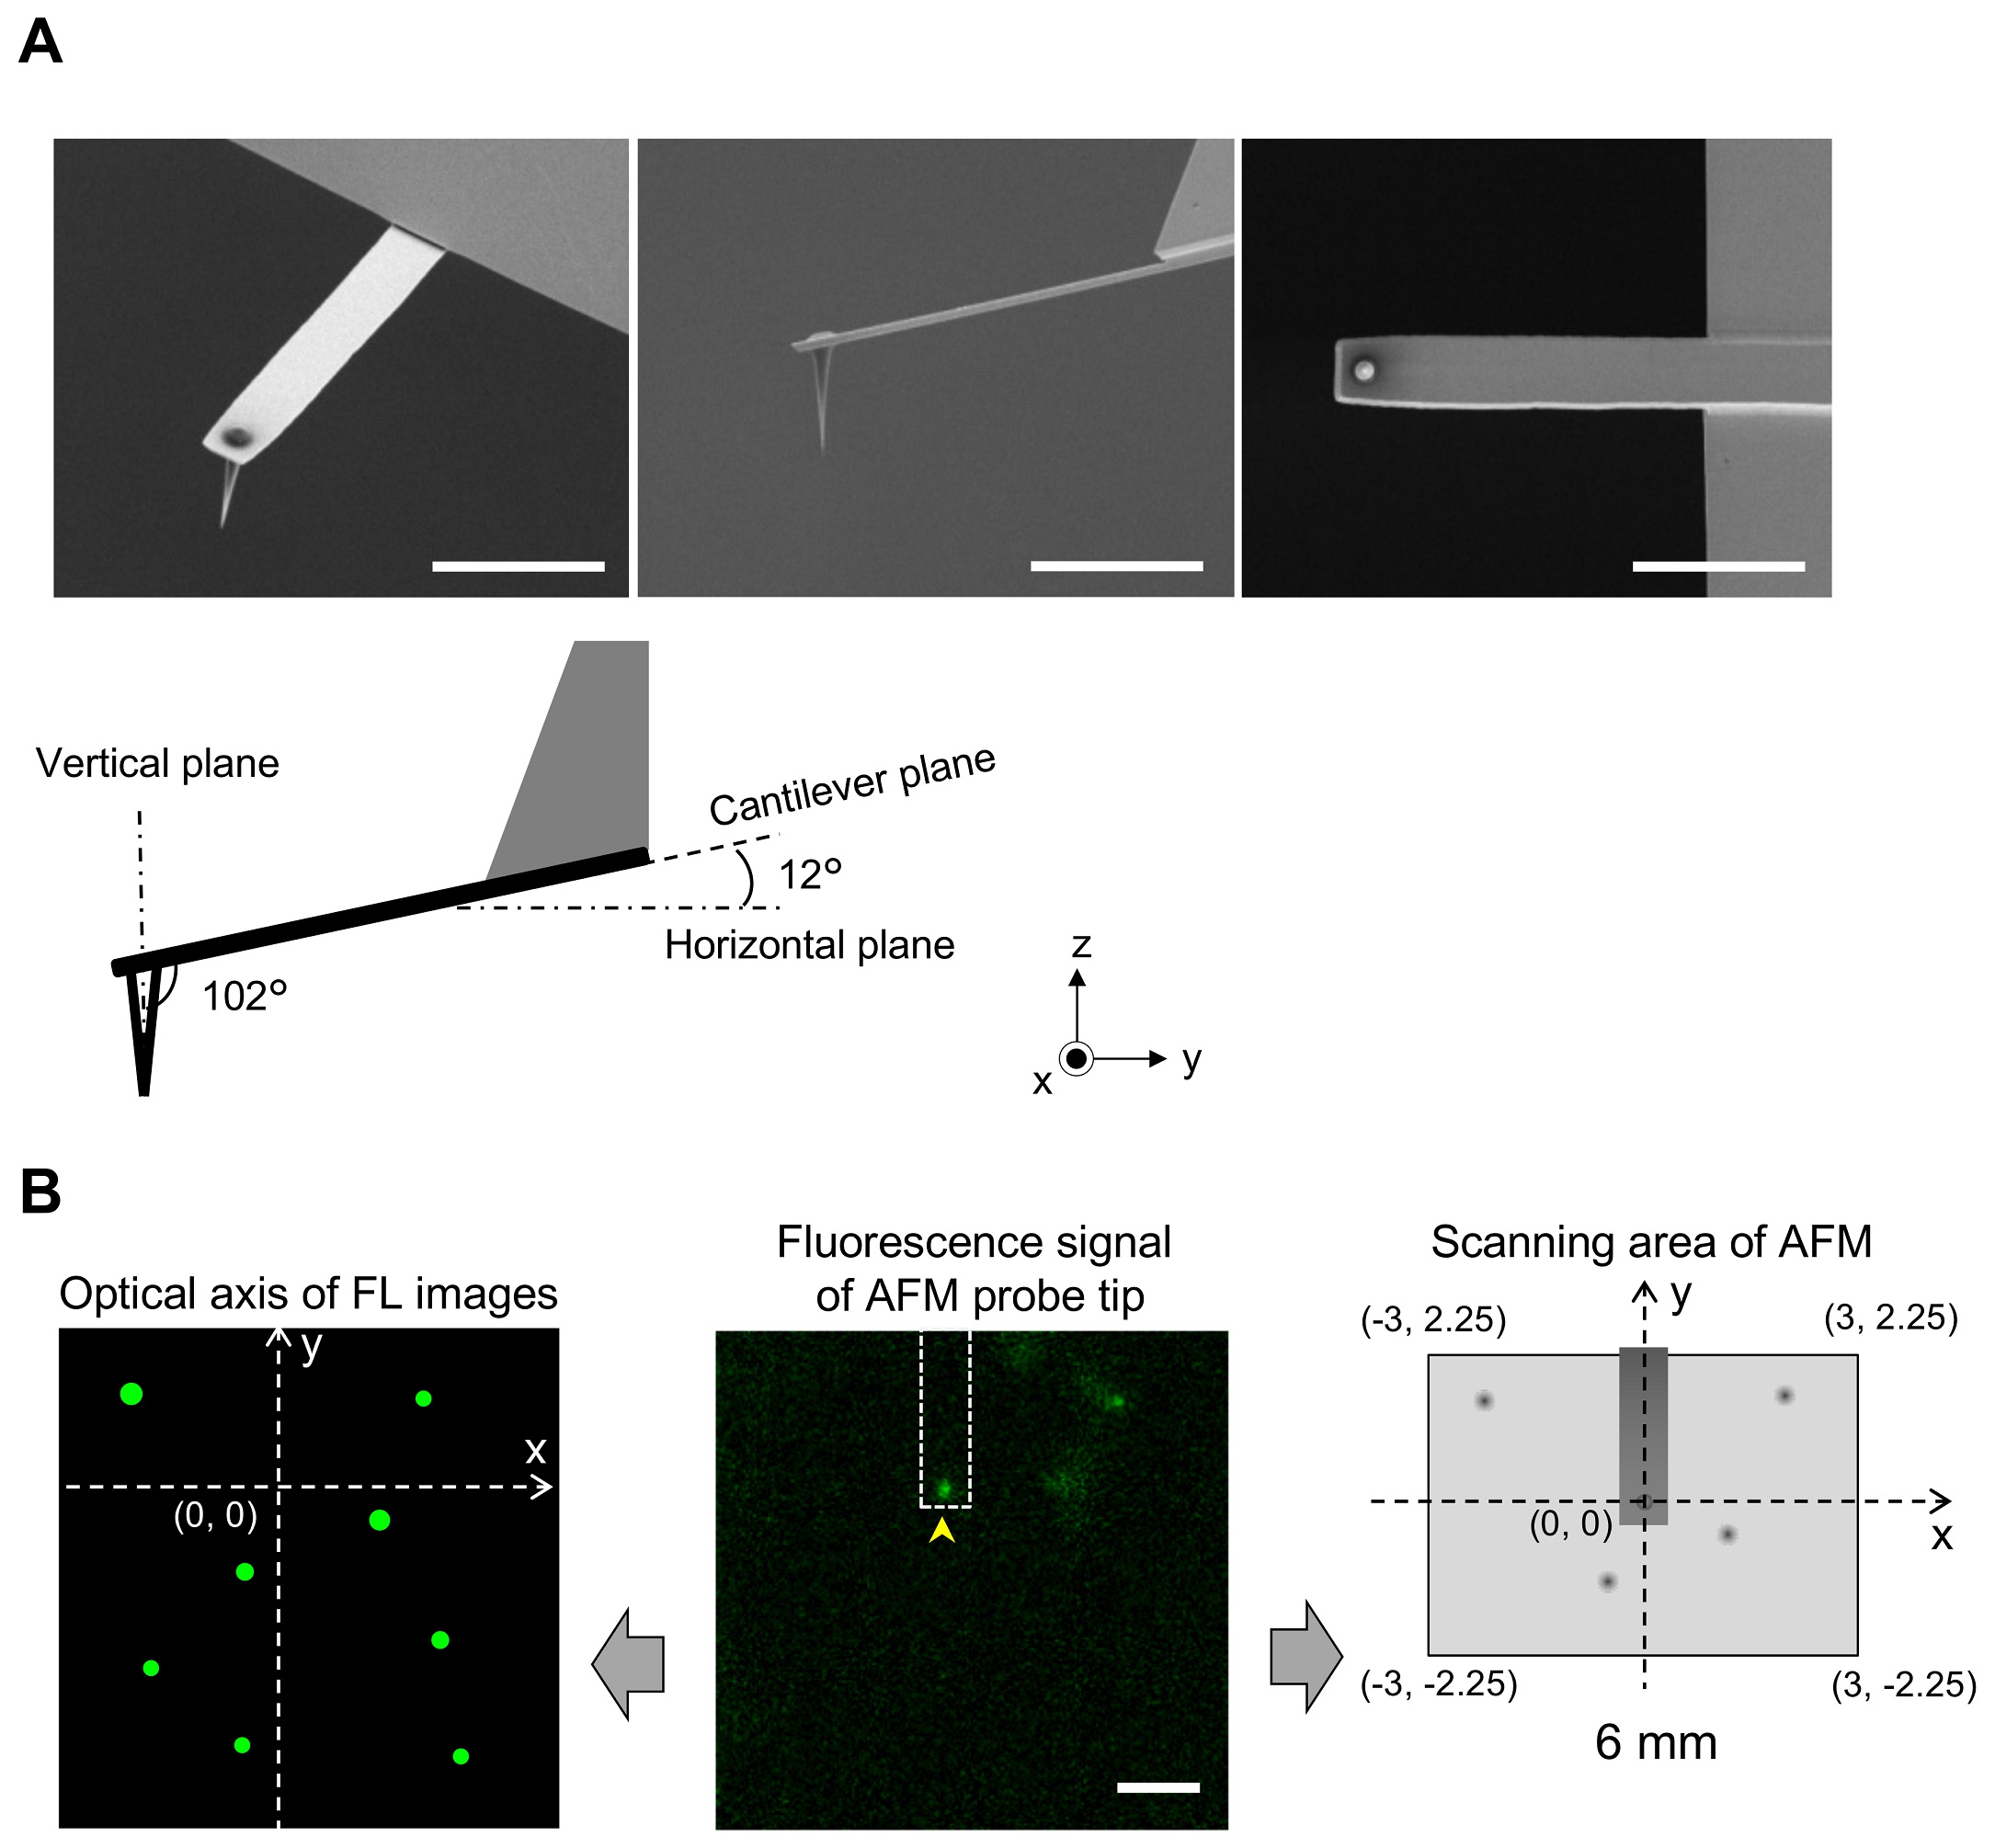
NanoWorld Ultra-Short Cantilevers USC-F0.3-k0.3 for High-Speed AFM (HS-AFM) with a typical spring constant of 0.3 N nm−1 and a typical resonance frequency of about 300 kHz were used for image acquisition with fast scanning atomic force microscopy.*
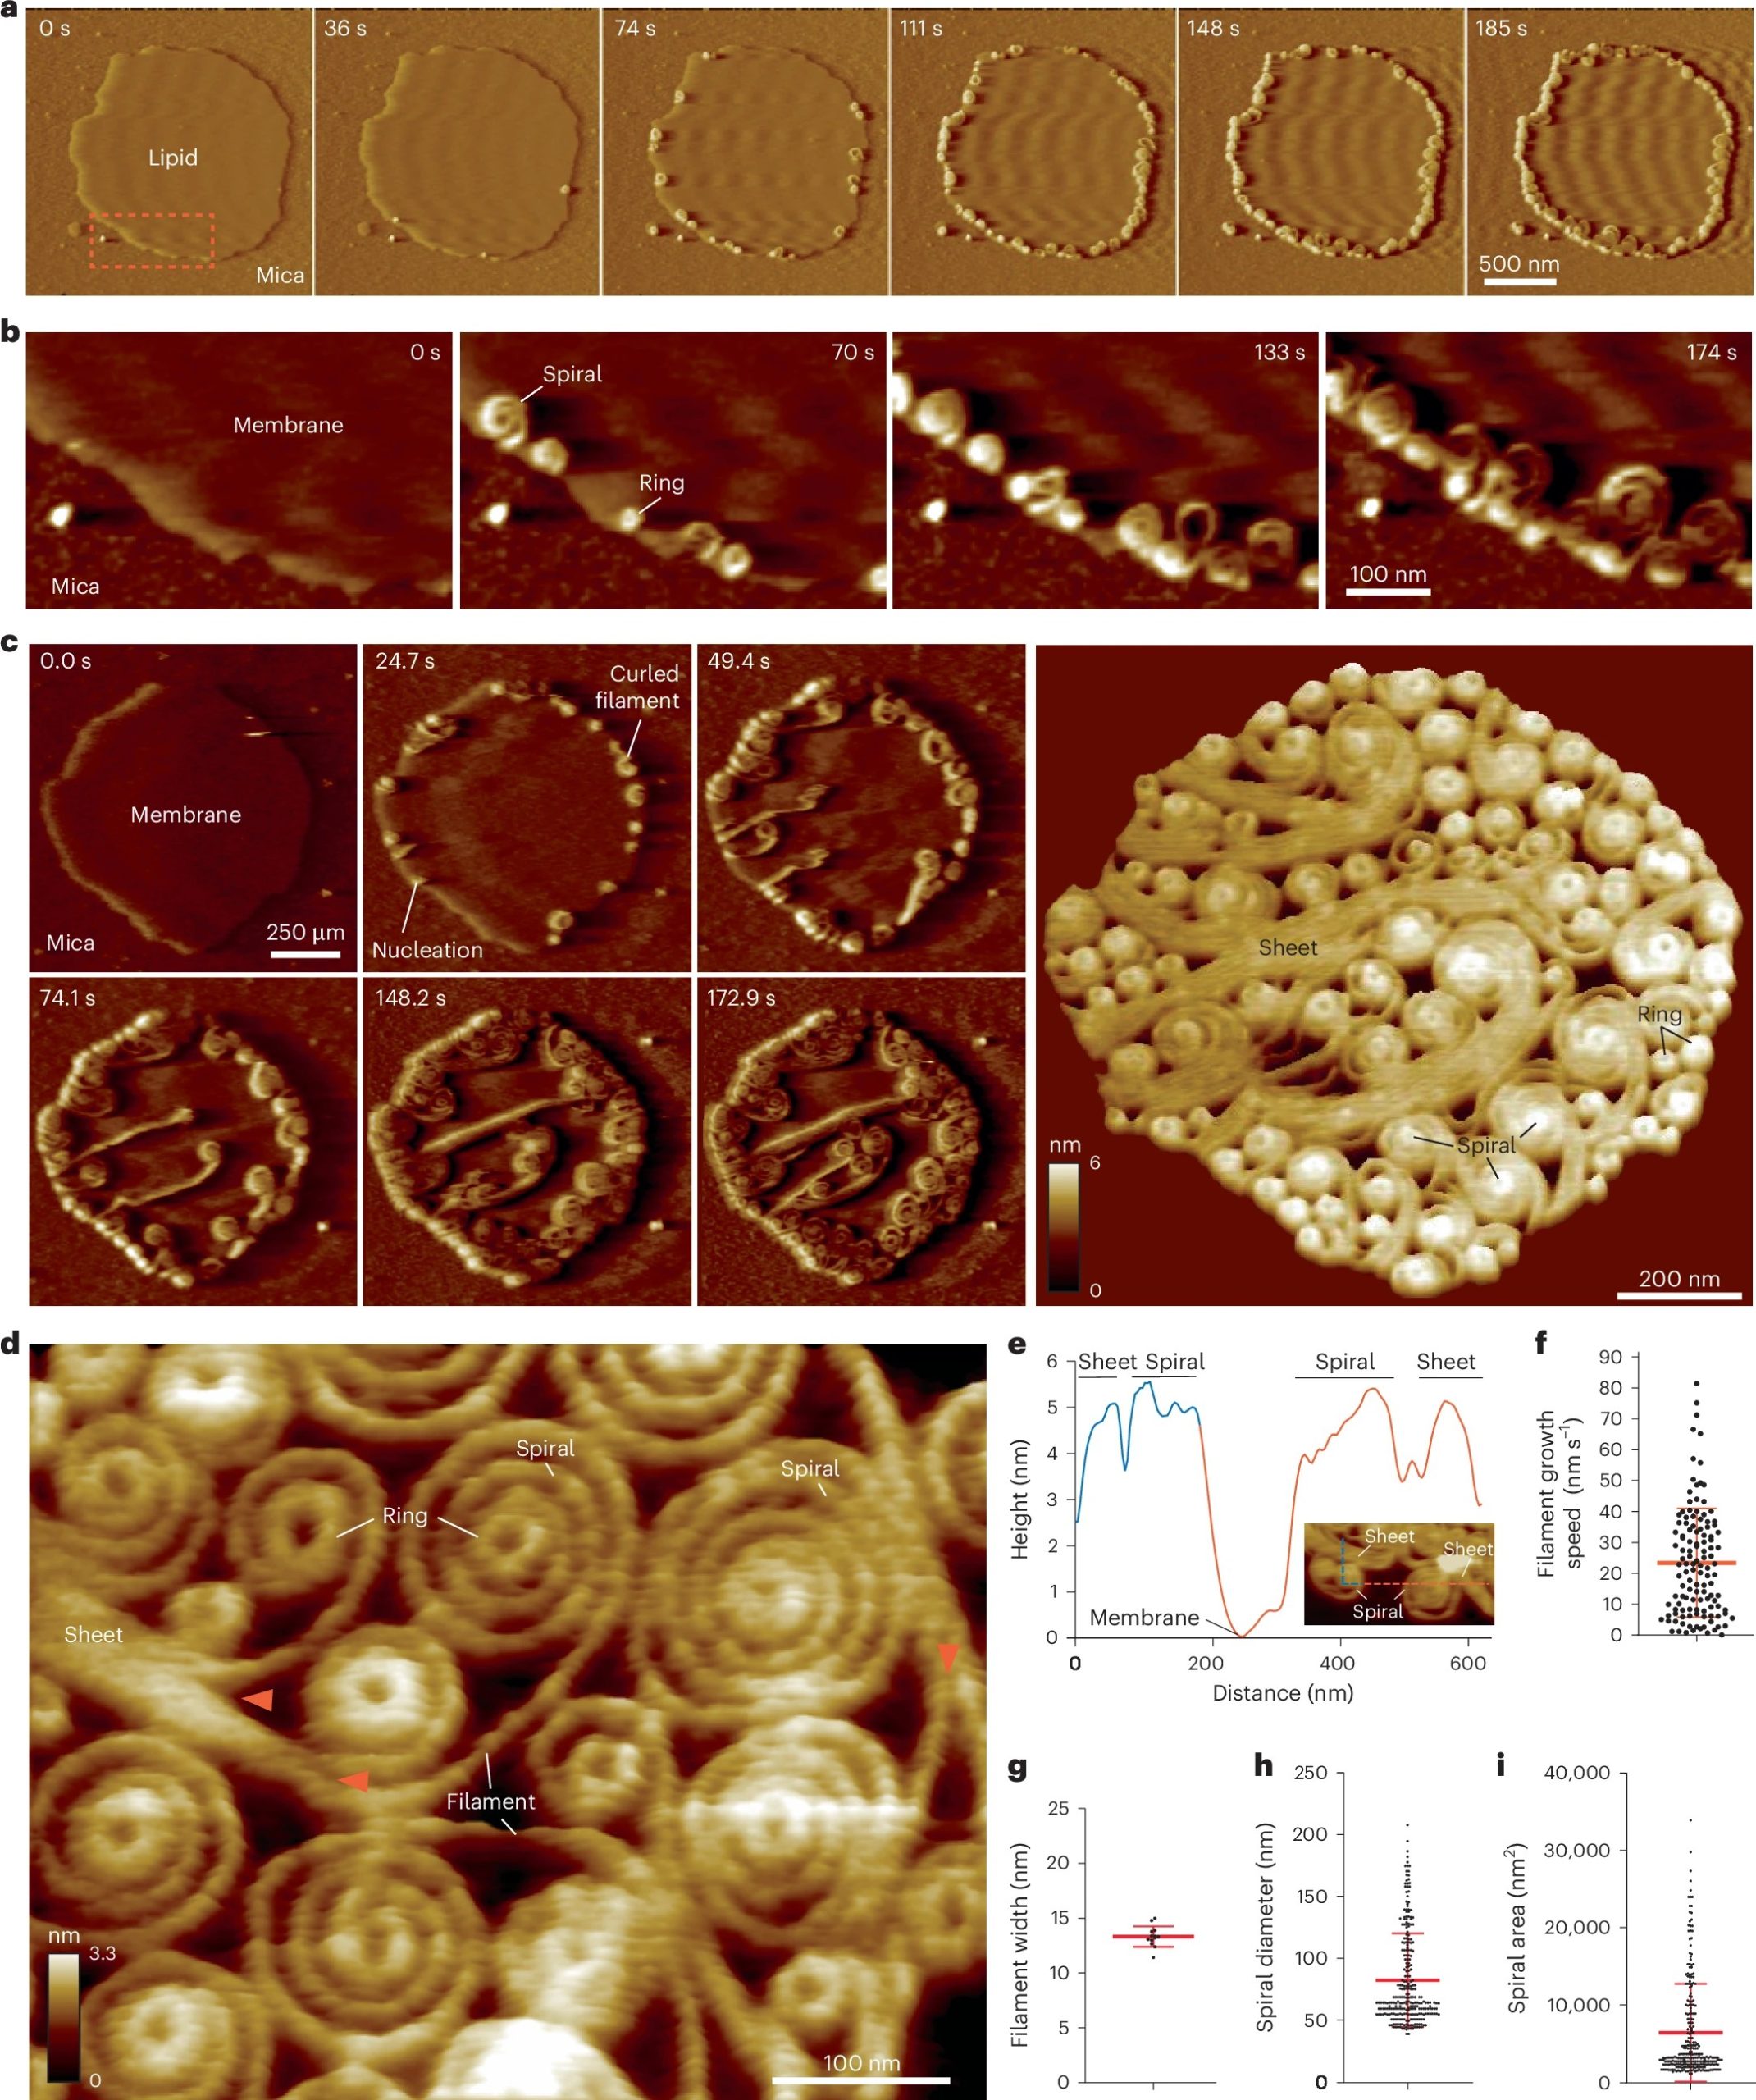
Vipp1 assembles dynamic networks of spirals, rings and sheets on membrane
a, F-AFM phase timecourse showing Vipp1 recruitment to the highly curved edge of membrane patches. Scan rate, 70 Hz; 256 × 256 pixels. The area in the dashed box is enlarged in b. b, Spiral and ring formation localized to the membrane edge. Scan rate, 70 Hz; 256 × 256 pixels. c, Left, phase timecourse showcasing a dense network of sheets, spirals, and rings that ultimately cover the entire membrane plane. Right, average of six F-AFM height images. Scan rate, 120 Hz; 256 × 256 pixels. d, Average F-AFM height image showing Vipp1 sheet, spiral, and ring detail. Red arrows mark the sheet branching into filaments ~13 nm wide. Scan rate, 20 Hz; 256 × 256 pixels. e, Vipp1 sheet and spiral filament height offset from the membrane. f–i, Quantification of Vipp1 filament and spiral characteristics. n = 124, 13, 278, and 278 independent measurements for panels f, g, h, and i, respectively. Error bars show one s.d. of the mean.
*Souvik Naskar, Andrea Merino, Javier Espadas, Jayanti Singh, Aurelien Roux, Adai Colom and Harry H. Low
Mechanism for Vipp1 spiral formation, ring biogenesis, and membrane repair
Nature Structural & Molecular Biology (2024)
DOI: https://doi.org/10.1038/s41594-024-01401-8
Open Access The article “Mechanism for Vipp1 spiral formation, ring biogenesis, and membrane repair” by Souvik Naskar, Andrea Merino, Javier Espadas, Jayanti Singh, Aurelien Roux, Adai Colom and Harry H. Low is licensed under a Creative Commons Attribution 4.0 International License, which permits use, sharing, adaptation, distribution and reproduction in any medium or format, as long as you give appropriate credit to the original author(s) and the source, provide a link to the Creative Commons license, and indicate if changes were made. The images or other third party material in this article are included in the article’s Creative Commons license, unless indicated otherwise in a credit line to the material. If material is not included in the article’s Creative Commons license and your intended use is not permitted by statutory regulation or exceeds the permitted use, you will need to obtain permission directly from the copyright holder. To view a copy of this license, visit http://creativecommons.org/licenses/by/4.0/.