Glycosaminoglycan-based biohybrid hydrogels are highly promising materials for tissue engineering and regenerative medicine due to their ability to provide cell-instructive environments. In this article, Jana Sievers-Liebschner, Ron Dockhorn, Jens Friedrichs, Thomas Kurth, Peter Fratzl, Jens-Uwe Sommer, Carsten Werner, and Uwe Freudenberg investigate the nanoscale molecular network structure of these hydrogels using an integrated analytical approach.
The study combines transmission electron microscopy, X-ray scattering, computer simulations, and AFM-based nanoindentation to quantitatively characterize nanoscale polymer network connectivity and structural inhomogeneities. These parameters are essential for understanding hydrogel mechanics, growth factor delivery, and cell–material interactions relevant to regenerative therapies and organoid culture systems.
Atomic force microscopy (AFM)-based nanoindentation measurements were performed to determine the mechanical stiffness of the hydrogels in both PBS and ethanol environments. Measurements were conducted using a modified NanoWorld tipless Pyrex-Nitride PNP-TR-TL-Au AFM probe equipped with a 10 μm silica bead for colloidal probe nanoindentation.
Nanoindentation experiments were carried out using a set point of 6 nN and an approach/retract velocity of 5 μm/s. At least 70 force–distance curves were recorded for each sample at different positions across the hydrogel surface. Young’s modulus values were extracted using the Hertz model, enabling quantitative evaluation of hydrogel nanomechanical properties.
This work demonstrates how AFM-based nanoindentation with a NanoWorld AFM probe contributes to the detailed characterization of biohybrid hydrogel networks and supports the development of engineered matrices for biomedical applications.
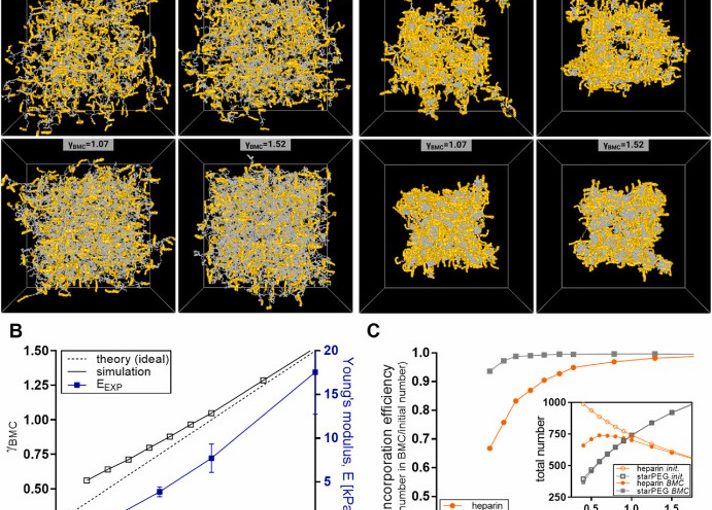
Fig. 5. Computational modelling of starPEG-heparin hydrogel networks. A: Simulation snapshots of hydrated and dehydrated starPEG-heparin hydrogels. For the hydrated network (A1), a good solvent (equivalent to PBS) was assumed. To model the dehydrated state (A2), parameters were adjusted to promote the self-aggregation of starPEG molecules in a poor solvent (e.g., ethanol). Networks with different effective molar ratios after crosslinking (γBMC, where BMC is the Biggest Molecule Cluster) are shown, assuming a 90 % extent of reaction between starPEG (grey) and heparin (yellow). Cube size: L = 150 nm. B: Molar ratio of the BMC γBMC after crosslinking at an extent of reaction p = 0.9, plotted as a function of the initial molar ratio. The dotted line represents the theoretical ideal value, while the blue line shows the experimentally determined Young’s moduli as a function of crosslinking degree. C: Incorporation efficiency of starPEG and heparin within the BMC, calculated as the number of starPEG or heparin molecules in the BMC divided by the number in the reaction mixture (ideal network). Insert: Total number of starPEG or heparin molecules in the reaction mixture (initial) or within the BMC. (For interpretation of the references to colour in this figure legend, the reader is referred to the Web version of this article.)
Full citation:
Sievers-Liebschner, J.; Dockhorn, R.; Friedrichs, J.; Kurth, T.; Fratzl, P.; Sommer, J.-U.; Werner, C.; Freudenberg, U. Unravelling the molecular network structure of biohybrid hydrogels.
Materials Today Bio 2025, 34, 102249. https://doi.org/10.1016/j.mtbio.2025.102249
Open Access The article “ Unravelling the molecular network structure of biohybrid hydrogels” is licensed under a Creative Commons Attribution 4.0 International License, which permits use, sharing, adaptation, distribution and reproduction in any medium or format, as long as you give appropriate credit to the original author(s) and the source, provide a link to the Creative Commons license, and indicate if changes were made. The images or other third party material in this article are included in the article’s Creative Commons license, unless indicated otherwise in a credit line to the material. If material is not included in the article’s Creative Commons license and your intended use is not permitted by statutory regulation or exceeds the permitted use, you will need to obtain permission directly from the copyright holder. To view a copy of this license, visit http://creativecommons.org/licenses/by/4.0/.
Collagen is the most abundant structural protein in mammals. *
Type I collagen in its fibril form has a characteristic pattern structure that alternates two regions called gap and overlap. The structure and properties of collagens are highly dependent on the water and mineral content of the environment. *
In the article “Interfacial water on collagen nanoribbons by 3D AFM” Diana M. Arvelo, Clara Garcia-Sacristan, Enrique Chacón, Pedro Tarazona and Ricardo Garcia describe how they apply three dimensional atomic force microscopy (3D AFM) to characterize at angstrom-scale resolution the interfacial water structure of collagen nanoribbons.*
Three-dimensional AFM (3D AFM) is an AFM method developed for imaging at high-spatial resolution solid–liquid interfaces in the three spatial coordinates.*
This method has provided atomic-scale images of hydration and solvation layers on a variety of rigid and atomically flat surfaces, such as mica, gibbsite, boehmite, graphite, or 2D materials.*
However, imaging hydration layers on soft materials such as collagen is more challenging than on atomically flat crystalline surfaces.*
On the one hand, the force applied by the AFM tip might deform the protein. On the other hand, the height variations across gap and overlap regions might complicate the imaging of interfacial water.*
In recent years, 3D AFM has expanded its capabilities to image interfacial water on soft materials such as proteins, biopolymers, DNA, lipids, membrane proteins, and cells.*
Those experiments were performed with hydrophilic SiOx AFM tips which are negatively charged under neutral pH conditions.*
The imaging contrast mechanisms and the role of the AFM tip’s composition on the observed solvation structure are under discussion.*
More generally, both theory and experiments performed with very high salt concentrations indicated that the contrast observed in 3D AFM reflects an interplay between water particle and surface charge density distributions.*
For their article the authors apply 3D AFM to study at molecular-scale spatial resolution the structure of interfacial water on collagen nanoribbons.*
Diana M. Arvelo et al. study the influence of the AFM tip’s charge and the salt concentration on the interfacial solvent structure. They report that the interfacial structure depends on the water particle and ion charge density distributions. A non-charged AFM tip reveals the formation of hydration layers on both gap and overlap regions. A negatively charged AFM tip shows that on a gap region, the solvation structure might depart from that of the hydration layers. This effect is attributed to the adsorption of ions from the solution. Those ions occupy the voids existing between collagen molecules in the gap region. *
A home-made three-dimensional AFM was implemented on a commercially available AFM. 3D AFM was performed in the amplitude modulation mode by exciting the AFM cantilever at its first eigenmode.
At the same time when the AFM cantilever oscillates with respect to its equilibrium position, a sinusoidal signal is applied to the z-piezo to modify the relative z-distance between the sample and the AFM tip. *
Diana M. Arvelo et al. have used z-piezo displacements with amplitudes of 2.0 nm and a period (frequency) of 10 ms (100 Hz). The z-piezo signal is synchronized with the xy-displacements in such a way that for each xy-position on the surface of the material, the AFM tip performs a single and complete z-cycle. The z-data are read out every 10.24 µs and stored in 512 pixels (256 pixels per half cycle). Each xy-plane of the 3D map contains 80 × 64 pixels. Hence, the total time to acquire such a 3D-AFM image is 52 s.*
The 3D AFM experiments were performed with two types of AFM probes with different surface chemistries which have different chemical properties in aqueous solutions.*
The high-density carbon/diamond-like AFM tips grown on quartz-like AFM cantilevers that Diana M. Arvelo et al. et al used ( NanoWorld Ultra-Short CantileversUSC-F1.2-k7.3 for high-speed AFM) remain uncharged at pH 7.4 and are called “neutral” AFM tips in the article.
The silicon AFM cantilevers with silicon AFM tips (NanoWorld Arrow-UHFAuD ultra-high frequency AFM probes) are negatively charged at neutral pH (silicon tips for short in the text) and were used to observe the formation of collagen nanoribbons.
All silicon AFM tips are readily oxidized and are usually covered by a thin native oxide layer which is hydrophilic.
The hydroxyl groups on the surface of the silicon AFM tip become negatively charged while the carbon AFM tips remain neutral (unchanged).
To image at angstrom-scale resolution, the interfacial water structure on the collagen requires reducing the lateral and vertical imaging sizes, respectively, to 5 and 1.5 nm.*
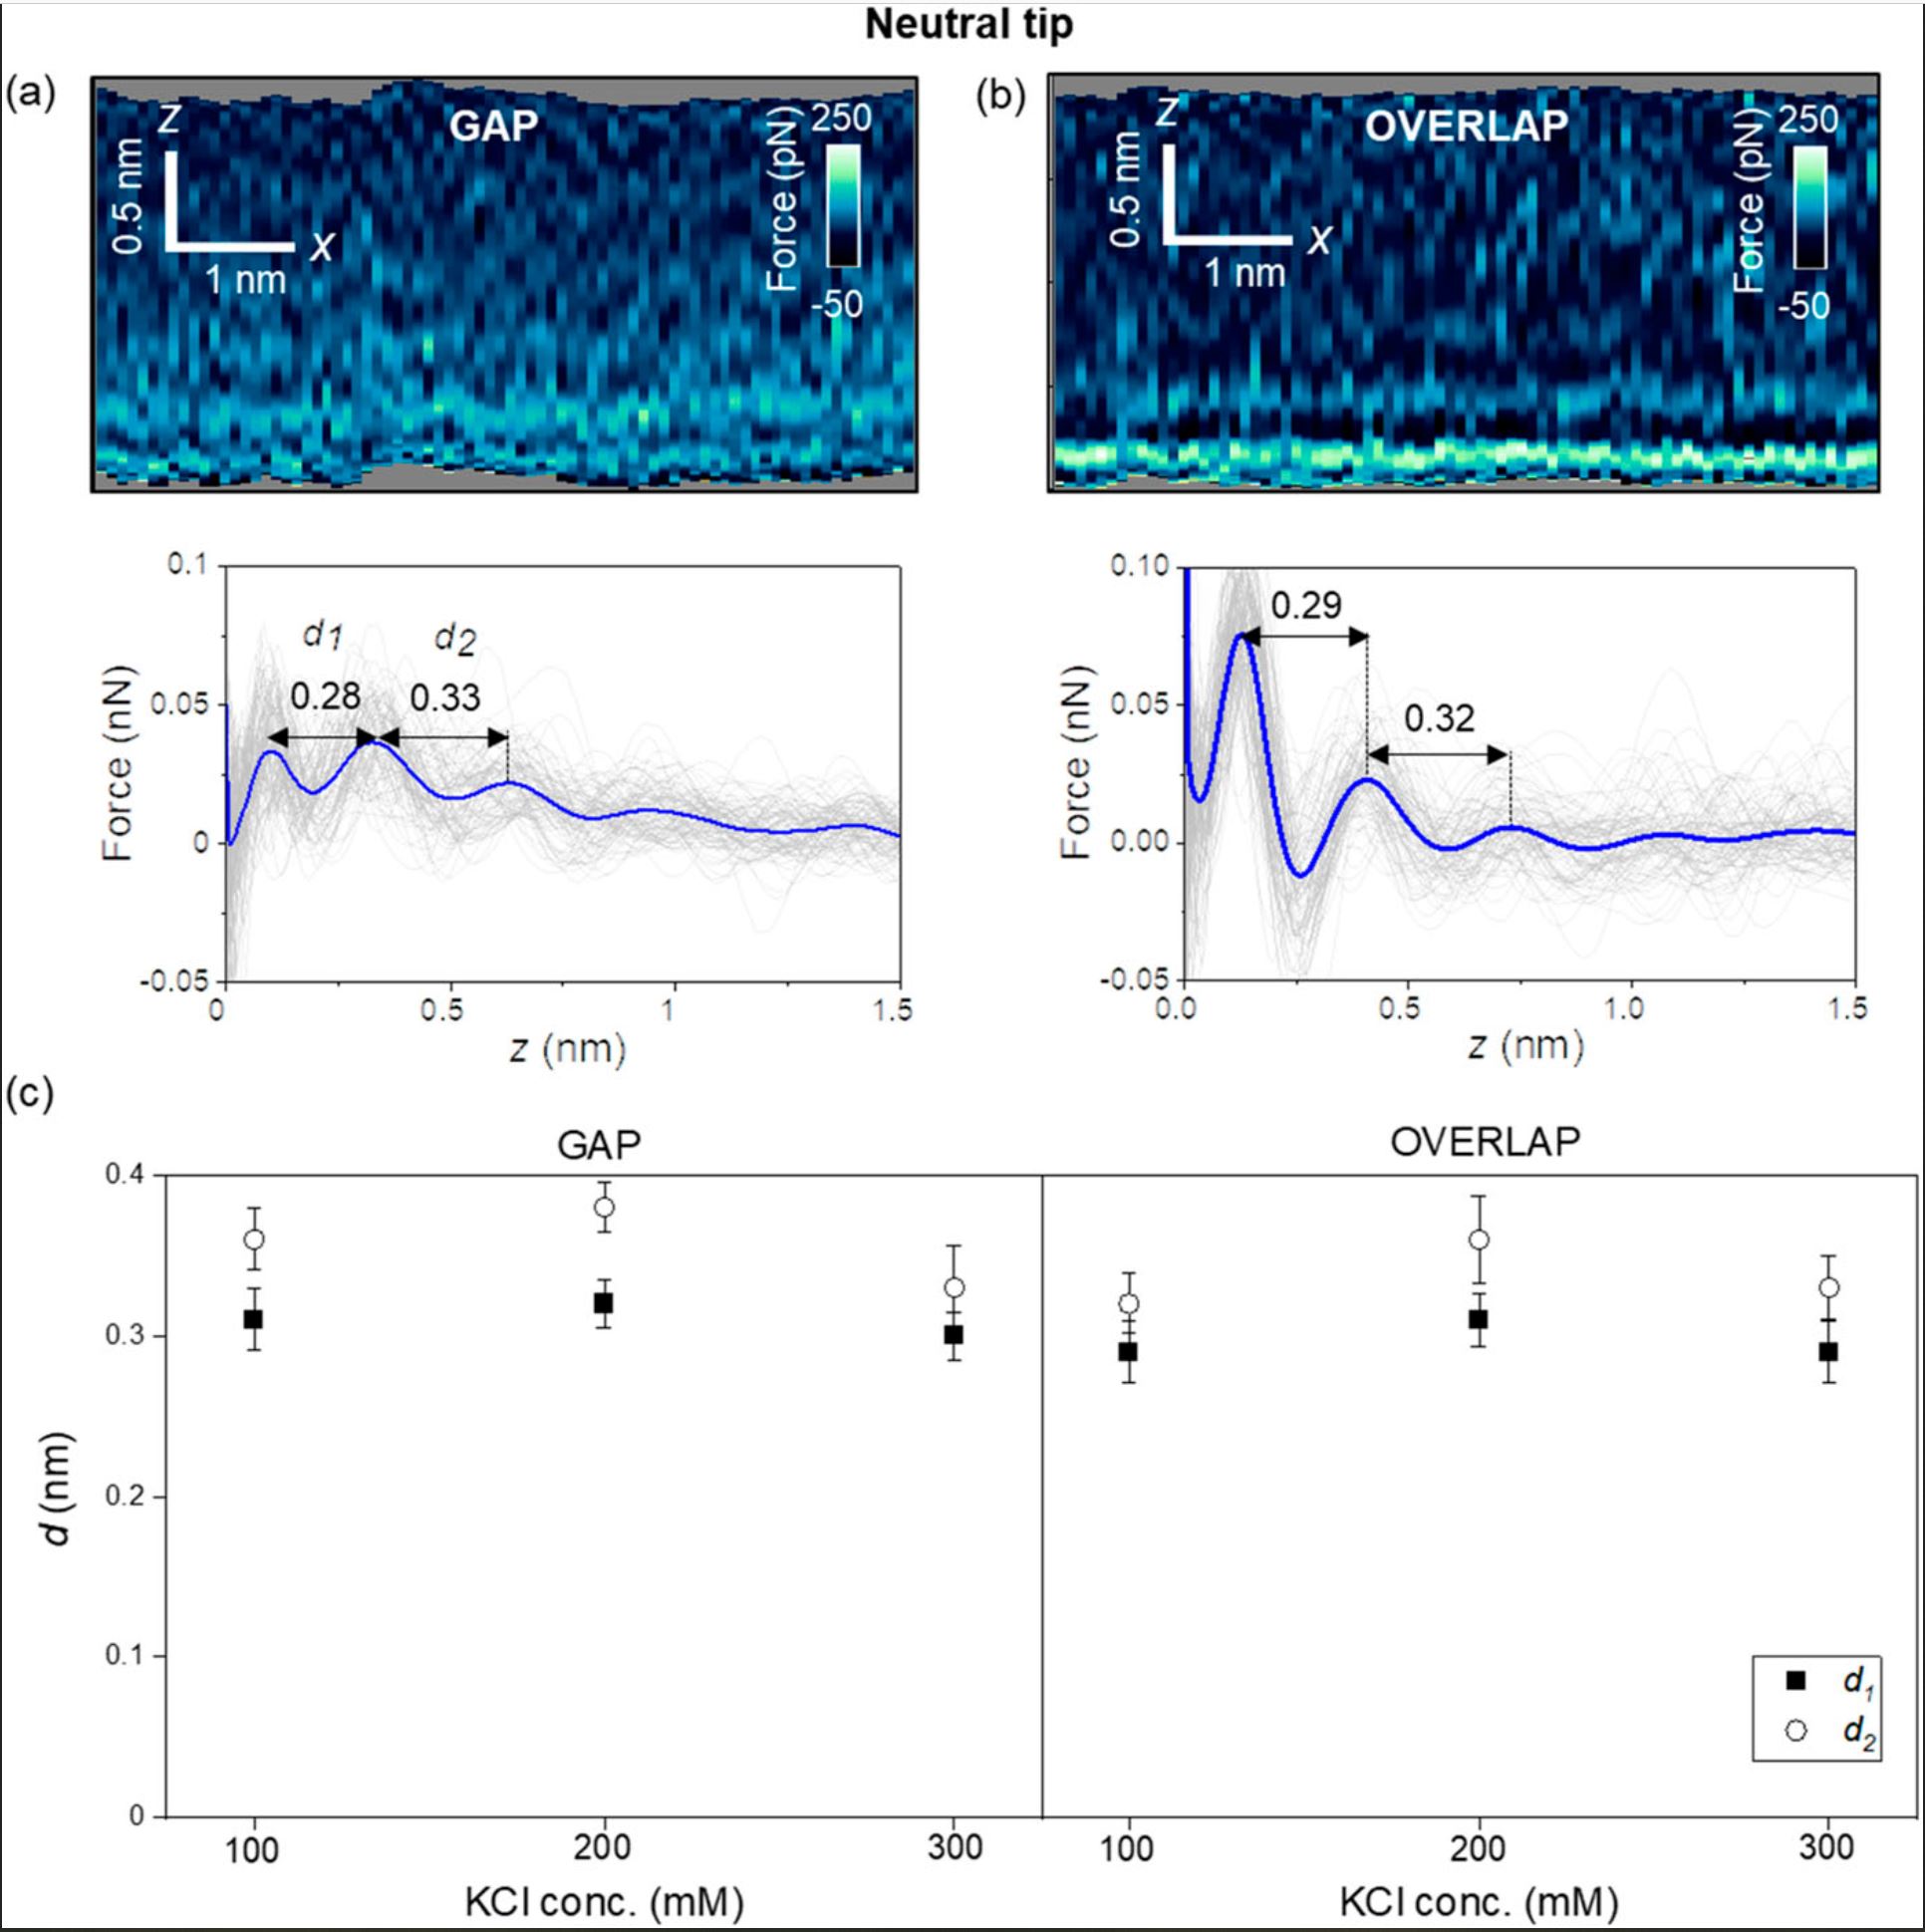
First, the authors introduce the results obtained with carbon-based tips (uncharged, NanoWorld Ultra-Short CantileversUSC-F1.2-k7.3 for high-speed AFM). Figure 2 (of the cited article) shows some representative 2D force xz panels obtained on gap and overlap regions of a collagen nanoribbon in a concentration of 300 mM KCl. The panels are extracted from a 3D AFM image. The interlayer distances in a gap region are d1 = 0.28 nm and d2 = 0.33 nm (average values) [Fig. 2(a)], while those in an overlap region are d1 = 0.29 and d2 = 0.32 nm (average values) [Fig. 2(b)]. Those values coincide within the experimental error with the values expected for hydration layers on hydrophilic surfaces.
Next, the authors repeated the experiment using other salt concentrations. Figure 2(c) shows that the interlayers distances (within the experimental error) do not depend on the salt concentration or the collagen region. Diana M. Arvelo et al. remark that entropic effects make the second layer more disordered than the first; therefore, d2 ≥ d1.
The structure and properties of collagens are highly dependent on the water and mineral content of the environment.
For a neutral AFM tip (USC-F1.2-k7.3), the interfacial water structure is characterized by the oscillation of the water particle density distribution with a value of 0.3 nm (hydration layers). The interfacial structure does not depend on the collagen region.
Hydration layers are observed in overlap regions, while in gap regions, the interfacial solvent structure is dominated by electrostatic interactions. These interactions generate interlayer distances of 0.2 nm.
The achieved results still need to be explained by the theory of 3D AFM. More detailed theoretical simulations, which are beyond the scope of the cited study, will be required to quantitatively explain the interlayer distances observed over gap regions.
However, the results presented by the authors highlight the potential of 3D AFM to identify the solvent structures on proteins and the complexity of those interfaces.*
Figure 2 from Diana M. Arvelo et al. 2024 “Interfacial water on collagen nanoribbons by 3D AFM” Interfacial liquid water structure on collagen provided by an uncharged tip. (a) 2D force maps (x, y) of the interfacial water structure in the gap region. The map is obtained in a 300 mM KCl solution. The force–distance curves in the bottom of the image are obtained from the top panel. (b) 2D force maps (x, y) of the interfacial water structure in the overlap region. The force–distance curves in the bottom of the image are obtained from the top panel. (c) Statistics of d1 and d2 distances measured from several collagen–water interfaces. The individual force–distance curves from the bottom panels of (a) and (b) are plotted in gray. The average force–distance curve is highlighted by a thick continuous line. The experiments are performed with USC-F1.2-k7.3 cantilevers. Experimental parameters: f = 745 kHz; k = 6.7 N m−1; Q = 8.3; A0 = 150 pm; Asp = 100 pm.
Figure 3 from Diana M. Arvelo et al. 2024 “Interfacial water on collagen nanoribbons by 3D AFM” Interfacial liquid water structure on collagen provided by a negatively charged tip. (a) 2D force maps (x, y) of the interfacial water structure in the gap region. The map is obtained in a 300 mM KCl solution. The force–distance curves in the bottom of the image are obtained from the top panel. (b) 2D force maps (x, y) of the interfacial water structure in the overlap region. The force–distance curves in the bottom of the image are obtained from the top panel. (c) Statistics of d1 and d2 distances measured from several collagen–water interfaces. In the bottom panels of (a) and (b), the individual force–distance curves from the bottom panels of (a) and (b) are plotted in gray. The average force–distance curve is highlighted by a thick continuous line. The images were captured using ArrowUHF AuD cantilevers. Experimental parameters: f = 745 kHz; k = 8.3 N m−1; Q = 4.5; A0 = 170 pm; Asp = 100 pm.
*Diana M. Arvelo, Clara Garcia-Sacristan, Enrique Chacón, Pedro Tarazona and Ricardo Garcia Interfacial water on collagen nanoribbons by 3D AFM
Journal of Chemical Physics 160, 164714 (2024)
DOI: https://doi.org/10.1063/5.0205611
The article “Interfacial water on collagen nanoribbons by 3D AFM” by Diana M. Arvelo, Clara Garcia-Sacristan, Enrique Chacón, Pedro Tarazona and Ricardo Garcia is licensed under a Creative Commons Attribution 4.0 International License, which permits use, sharing, adaptation, distribution and reproduction in any medium or format, as long as you give appropriate credit to the original author(s) and the source, provide a link to the Creative Commons license, and indicate if changes were made. The images or other third-party material in this article are included in the article’s Creative Commons license, unless indicated otherwise in a credit line to the material. If material is not included in the article’s Creative Commons license and your intended use is not permitted by statutory regulation or exceeds the permitted use, you will need to obtain permission directly from the copyright holder. To view a copy of this license, visit https://creativecommons.org/licenses/by/4.0/.
We have a month with “R” again and the shellfish season has started in the Northern Hemisphere. So we’d like to share the Nature Communications article by Petrone et. al “Mussel adhesion is dictated by time-regulated secretion and molecular conformation of mussel adhesive proteins” with you.
A NanoWorld Pointprobe®NCSTR AFM probe was used for the AFM images in this paper. This AFM probe is designed to give extra stability and accuracy during soft tapping mode imaging in order to produce higher quality AFM images while minimizing sample damage.
Supplementary Figure 16 from Petrone et. al “Mussel adhesion is dictated by time-regulated secretion and molecular conformation of mussel adhesive proteins”: Atomic Force Microscopy (AFM) of mussel adhesive proteins on mica. AFM images of dry Pvfp-3α and Pvfp-5β adsorbed from 0.02 mg ml-1 solution in 5% acetic acid and 0.25 MO3 on mica. After 20 min adsorption, the mica surfaces were washed with protein -free buffer, and the AFM images show the homogenous distribution of the resulting adsorbed proteins. The height profiles for both proteins are shown in the graphs below, corresponding to the dotted red and blue lines in the respective AFM images (see black arrows).
Luigi Petrone, Akshita Kumar, Clarinda N. Sutanto, Navinkumar J. Patil, Srinivasaraghavan Kannan, Alagappan Palaniappan, Shahrouz Amini, Bruno Zappone, Chandra Verma, Ali Miserez Mussel adhesion is dictated by time-regulated secretion and molecular conformation of mussel adhesive proteins
Nature Communications volume 6, Article number: 8737 (2015)
DOI https://doi.org/10.1038/ncomms9737
The article by Petrone, L.et al. “Mussel adhesion is dictated by time-regulated secretion and molecular conformation of mussel adhesive proteins” is licensed under a Creative Commons Attribution 4.0 International License. The images or other third party material in this article are included in the article’s Creative Commons license, unless indicated otherwise in the credit line; if the material is not included under the Creative Commons license, users will need to obtain permission from the license holder to reproduce the material. To view a copy of this license, visit http://creativecommons.org/licenses/by/4.0/