During replication, expression, and repair of the eukaryotic genome, cellular machinery must access the DNA wrapped around histone proteins forming nucleosomes. These octameric protein·DNA complexes are modular, dynamic, and flexible and unwrap or disassemble either spontaneously or by the action of molecular motors. Thus, the mechanism of formation and regulation of subnucleosomal intermediates has gained attention genome-wide because it controls DNA accessibility.*
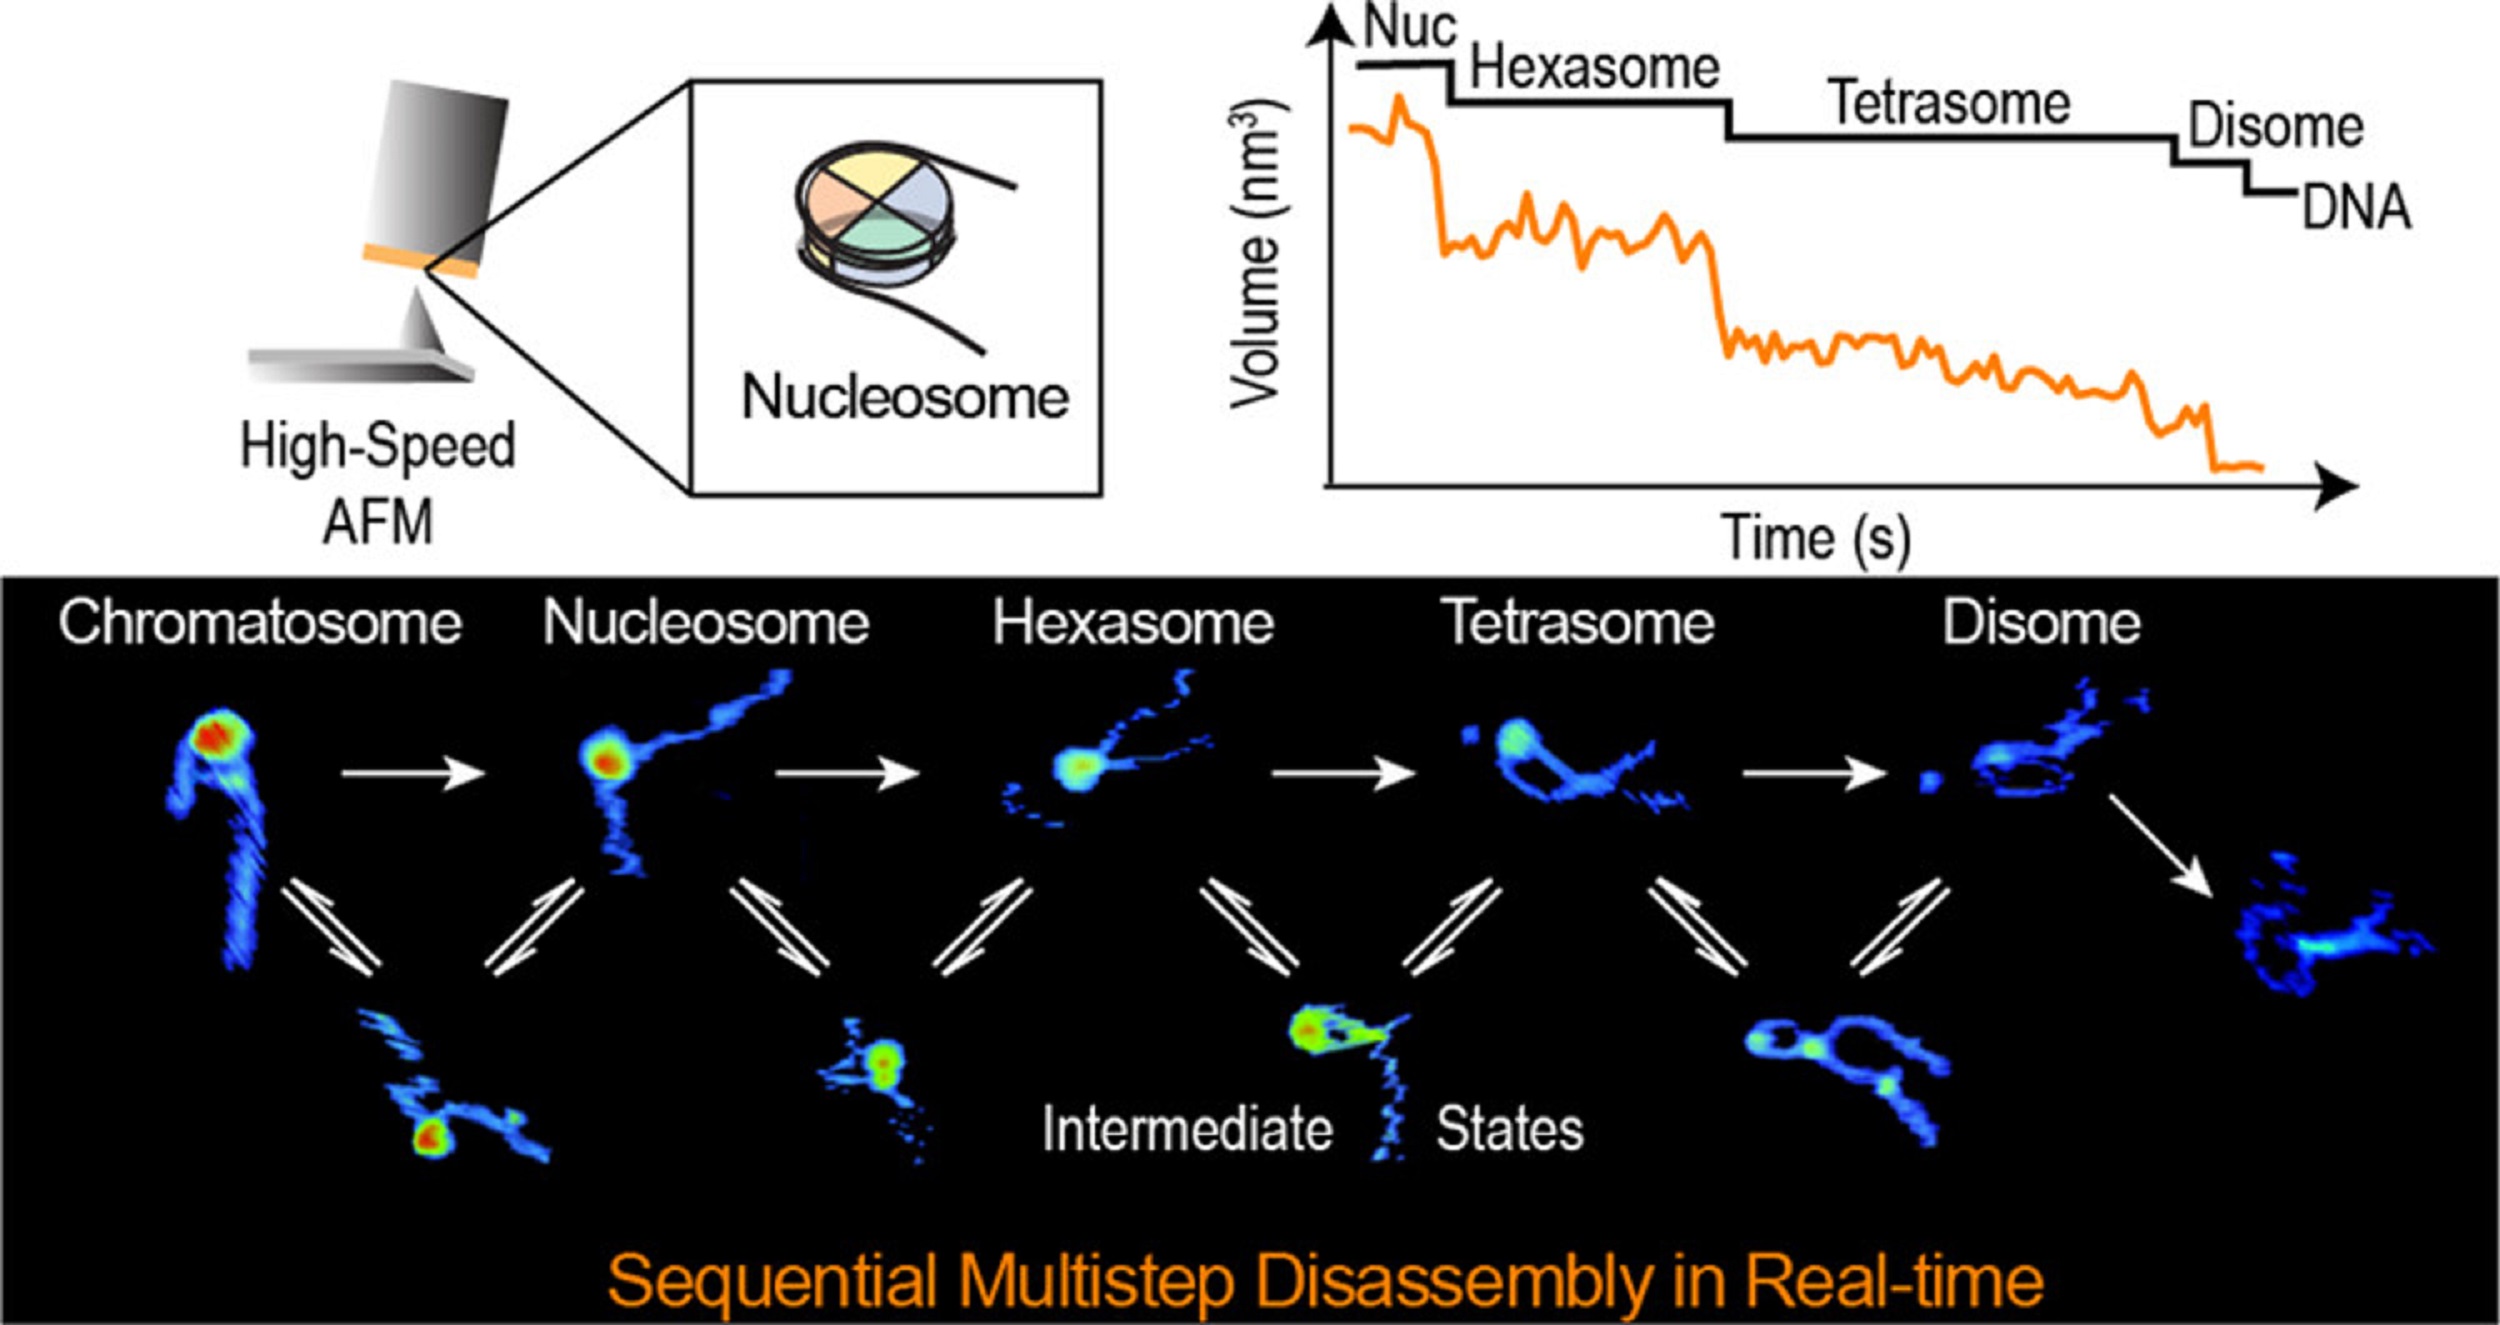
In the article “Real-Time Multistep Asymmetrical Disassembly of Nucleosomes and Chromatosomes Visualized by High-Speed Atomic Force Microscopy” Bibiana Onoa, César Díaz-Celis, Cristhian Cañari-Chumpitaz, Antony Lee and Carlos Bustamante describe how they imaged nucleosomes and their more compacted structure with the linker histone H1 (chromatosomes) using high-speed atomic force microscopy to visualize simultaneously the changes in the DNA and the histone core during their disassembly when deposited on mica.*
Furthermore, Bibiana Onoa et al. trained a neural network and developed an automatic algorithm to track molecular structural changes in real time. *
The authors’ results show that nucleosome disassembly is a sequential process involving asymmetrical stepwise dimer ejection events. The presence of H1 restricts DNA unwrapping, significantly increases the nucleosomal lifetime, and affects the pathway in which heterodimer asymmetrical dissociation occurs. *
Bibiana Onoa et al. observe that tetrasomes are resilient to disassembly and that the tetramer core (H3·H4)2 can diffuse along the nucleosome positioning sequence. Tetrasome mobility might be critical to the proper assembly of nucleosomes and can be relevant during nucleosomal transcription, as tetrasomes survive RNA polymerase passage. These findings are relevant to understanding nucleosome intrinsic dynamics and their modification by DNA-processing enzymes. *
To characterize the nucleosomes dynamics in 2D, individual molecules were observed in buffer using an Ando-type high speed atomic force microscope together with NanoWorld Ultra-Short Cantilevers for HS-AFM of the USC-F1.2-K0.15 AFM probe type ( typical spring constant 0.15 N/m, typical resonance frequency in air 1200 kHz, resonance frequency 500–600 kHz in liquid). *
The AFM data presented in the article allow the authors to directly visualize the dynamics of DNA and histones during nucleosome and chromatosome disassembly, providing a simultaneous observation of DNA unwrapping and histone dissociation. *
The experimental and analytical strategy presented shows that real-time HS-AFM is a robust and powerful tool for studying single nucleosomes and chromatin dynamics. *
graphical abstract from Bibiana Onoa et al 2024 “Real-Time Multistep Asymmetrical Disassembly of Nucleosomes and Chromatosomes Visualized by High-Speed Atomic Force Microscopy”
*Bibiana Onoa, César Díaz-Celis, Cristhian Cañari-Chumpitaz, Antony Lee and Carlos Bustamante Real-Time Multistep Asymmetrical Disassembly of Nucleosomes and Chromatosomes Visualized by High-Speed Atomic Force Microscopy
ACS Central Science 2024, 10, 1, 122–137
DOI: https://doi.org/10.1021/acscentsci.3c00735
Open Access The article “Real-Time Multistep Asymmetrical Disassembly of Nucleosomes and Chromatosomes Visualized by High-Speed Atomic Force Microscopy” by Bibiana Onoa, César Díaz-Celis, Cristhian Cañari-Chumpitaz, Antony Lee and Carlos Bustamante is licensed under a Creative Commons Attribution 4.0 International License, which permits use, sharing, adaptation, distribution and reproduction in any medium or format, as long as you give appropriate credit to the original author(s) and the source, provide a link to the Creative Commons license, and indicate if changes were made. The images or other third party material in this article are included in the article’s Creative Commons license, unless indicated otherwise in a credit line to the material. If material is not included in the article’s Creative Commons license and your intended use is not permitted by statutory regulation or exceeds the permitted use, you will need to obtain permission directly from the copyright holder. To view a copy of this license, visit http://creativecommons.org/licenses/by/4.0/.
Cells communicate with their environments via the plasma membrane and various membrane proteins. Clathrin-mediated endocytosis (CME) plays a central role in such communication and proceeds with a series of multiprotein assembly, deformation of the plasma membrane, and production of a membrane vesicle that delivers extracellular signaling molecules into the cytoplasm.*
In the article “Morphological changes of plasma membrane and protein assembly during clathrin-mediated endocytosis”, Aiko Yoshida, Nobuaki Sakai, Yoshitsugu Uekusa, Yuka Imaoka, Yoshitsuna Itagaki, Yuki Suzuki and Shige H. Yoshimura describe how they utilized their home-built correlative imaging system comprising high-speed atomic force microscopy (HS-AFM) and confocal fluorescence microscopy to simultaneously image morphological changes of the plasma membrane and protein localization during CME in a living cell.*
Overlaying AFM and fluorescence images revealed the dynamics of protein assembly and concomitant morphological changes of the plasma membrane with high spatial resolution. In particular, the authors elucidate the role of actin in the closing step of CME.*
The results revealed a tight correlation between the size of the pit and the amount of clathrin assembled. Actin dynamics play multiple roles in the assembly, maturation, and closing phases of the process, and affects membrane morphology, suggesting a close relationship between endocytosis and dynamic events at the cell cortex. Knock down of dynamin also affected the closing motion of the pit and showed functional correlation with actin.*
An AFM tip-scan–type HS-AFM unit combined with an inverted fluorescence/optical microscope equipped with a phase contrast system and a confocal unit was used for this study.*
The modulation method was set to phase modulation mode to detect AFM tip–sample interactions. A customized NanoWorld Ultra-Short AFM cantilever with an electron beam–deposited sharp AFM tip with a spring constant of 0.1 N m−1 (USC-F0.8-k0.1-T12) was used. *
All observations were performed at 28 °C. The AFM tip was aligned with confocal views as described in the Results section of the article. The images from the confocal microscope and AFM were simultaneously acquired at a scanning rate of 10 s/frame. The captured sequential images were overlaid by using AviUTL (http://spring-fragrance.mints.ne.jp/aviutl/) based on the AFM tip position.
The fluorescence intensity was quantified by Image J software (http://rsbweb.nih.gov/ij/). *
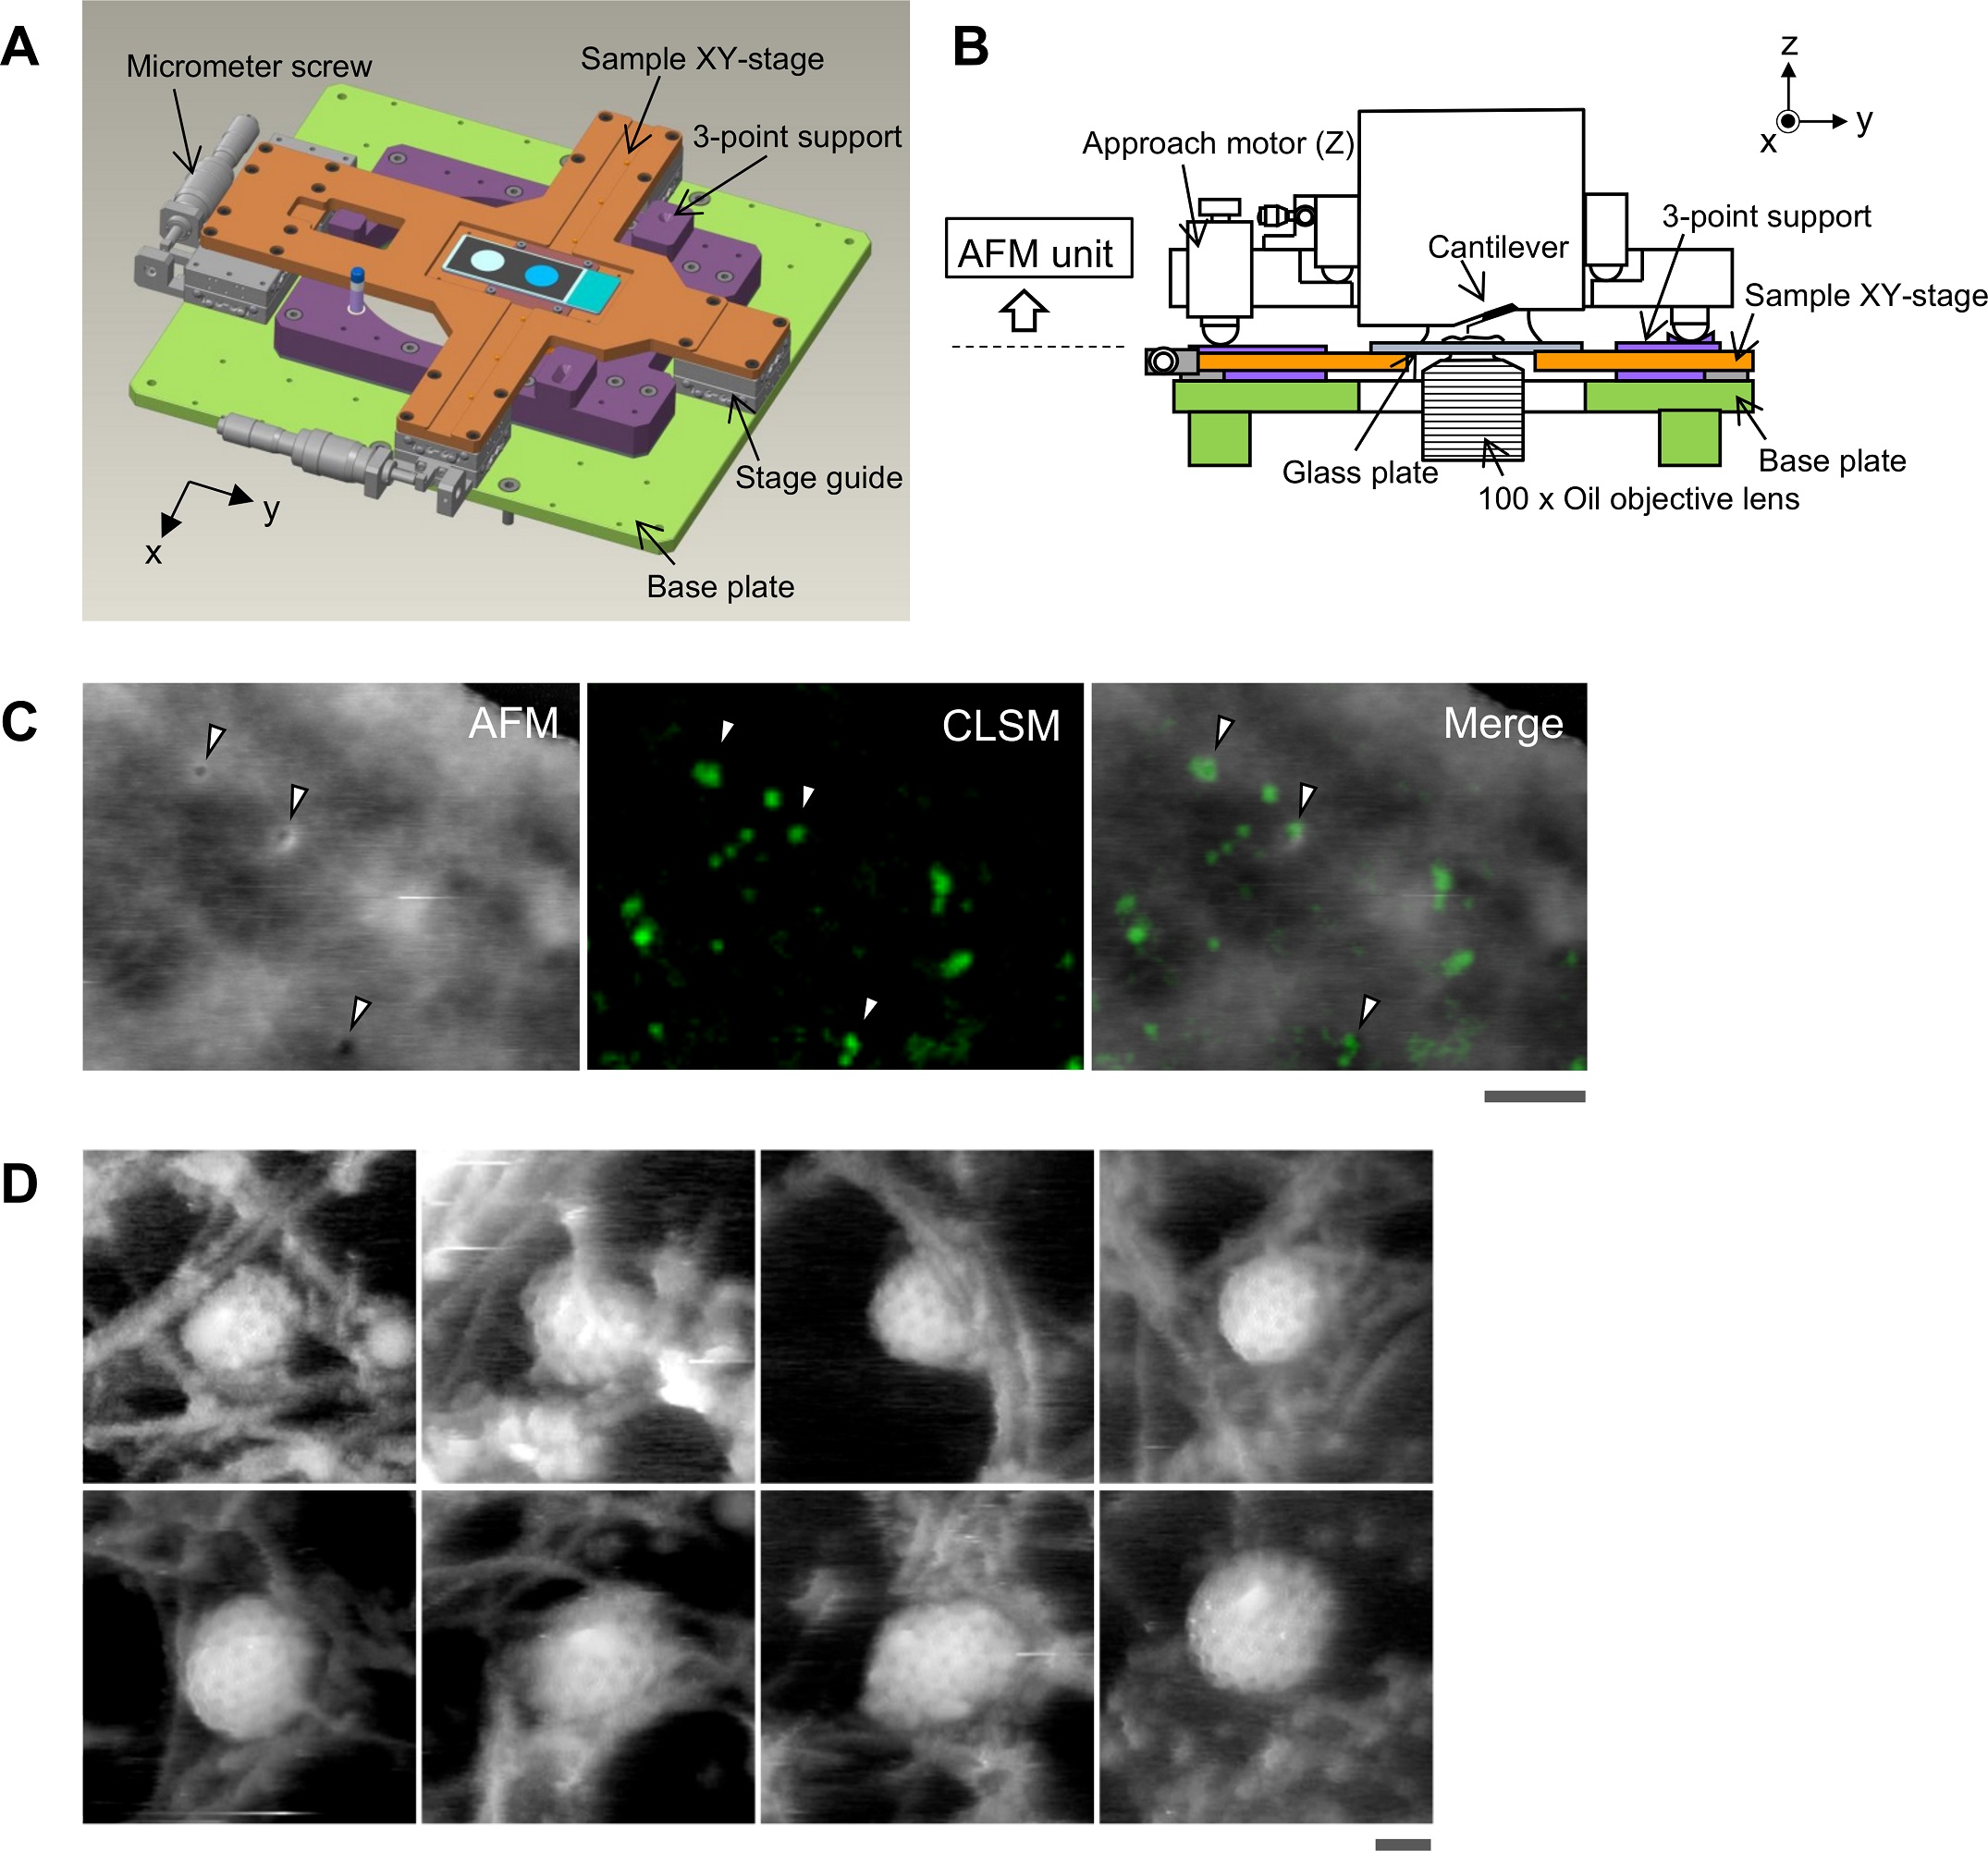
Fig 1 from Aiko Yoshida et al 2018 “Morphological changes of plasma membrane and protein assembly during clathrin-mediated endocytosis” : Aligning the confocal image and the AFM image. (A) Schematic illustration of the sample stage. A cross-shaped movable XY-stage (orange) is mounted on the base plate (light green) of the inverted optical microscope (IX83) via a stage guide (gray) equipped at each of the 4 ends of the cross. A 3-point support plate (purple) for mounting the AFM scanner unit is fixed on the base plate with a configuration that does not hinder the sliding of the XY-stage along the x-axis and y-axis. These setups allow the sample stage to move independently of the AFM unit and the optical axis. (B) Side view of the HS-AFM unit mounted on the stage illustrated in panel A. (C) Overlaying a confocal image and an AFM image. COS-7 cells expressing EGFP-CLCa were fixed with 5% paraformaldehyde and subjected to AFM (left) and CLSM (middle) imaging. The x-y position of the probe tip was determined as described in S1 Fig. Two images were overlaid (right) based on the x-y center position. Scale bar: 1 μm. Autofluorescence of the probe was much weaker than clathrin spot and could not be detected during the fast scanning. (D) AFM images of CCP on the cytoplasmic surface of the plasma membrane. COS-7 cells were “unroofed” by mild sonication as described in Materials and methods and then fixed with glutaraldehyde. Scale bar: 0.1 μm. AFM, atomic force microscopy; CCP, clathrin-coated pit; CLSM, confocal laser scanning microscopy; COS-7, CV-1 in origin with SV40 gene line 7; EGFP, enhanced green fluorescent protein; EGFP-CLCa, EGFP-fused clathrin light chain a; HS-AFM, high-speed AFM. https://doi.org/10.1371/journal.pbio.2004786.g001
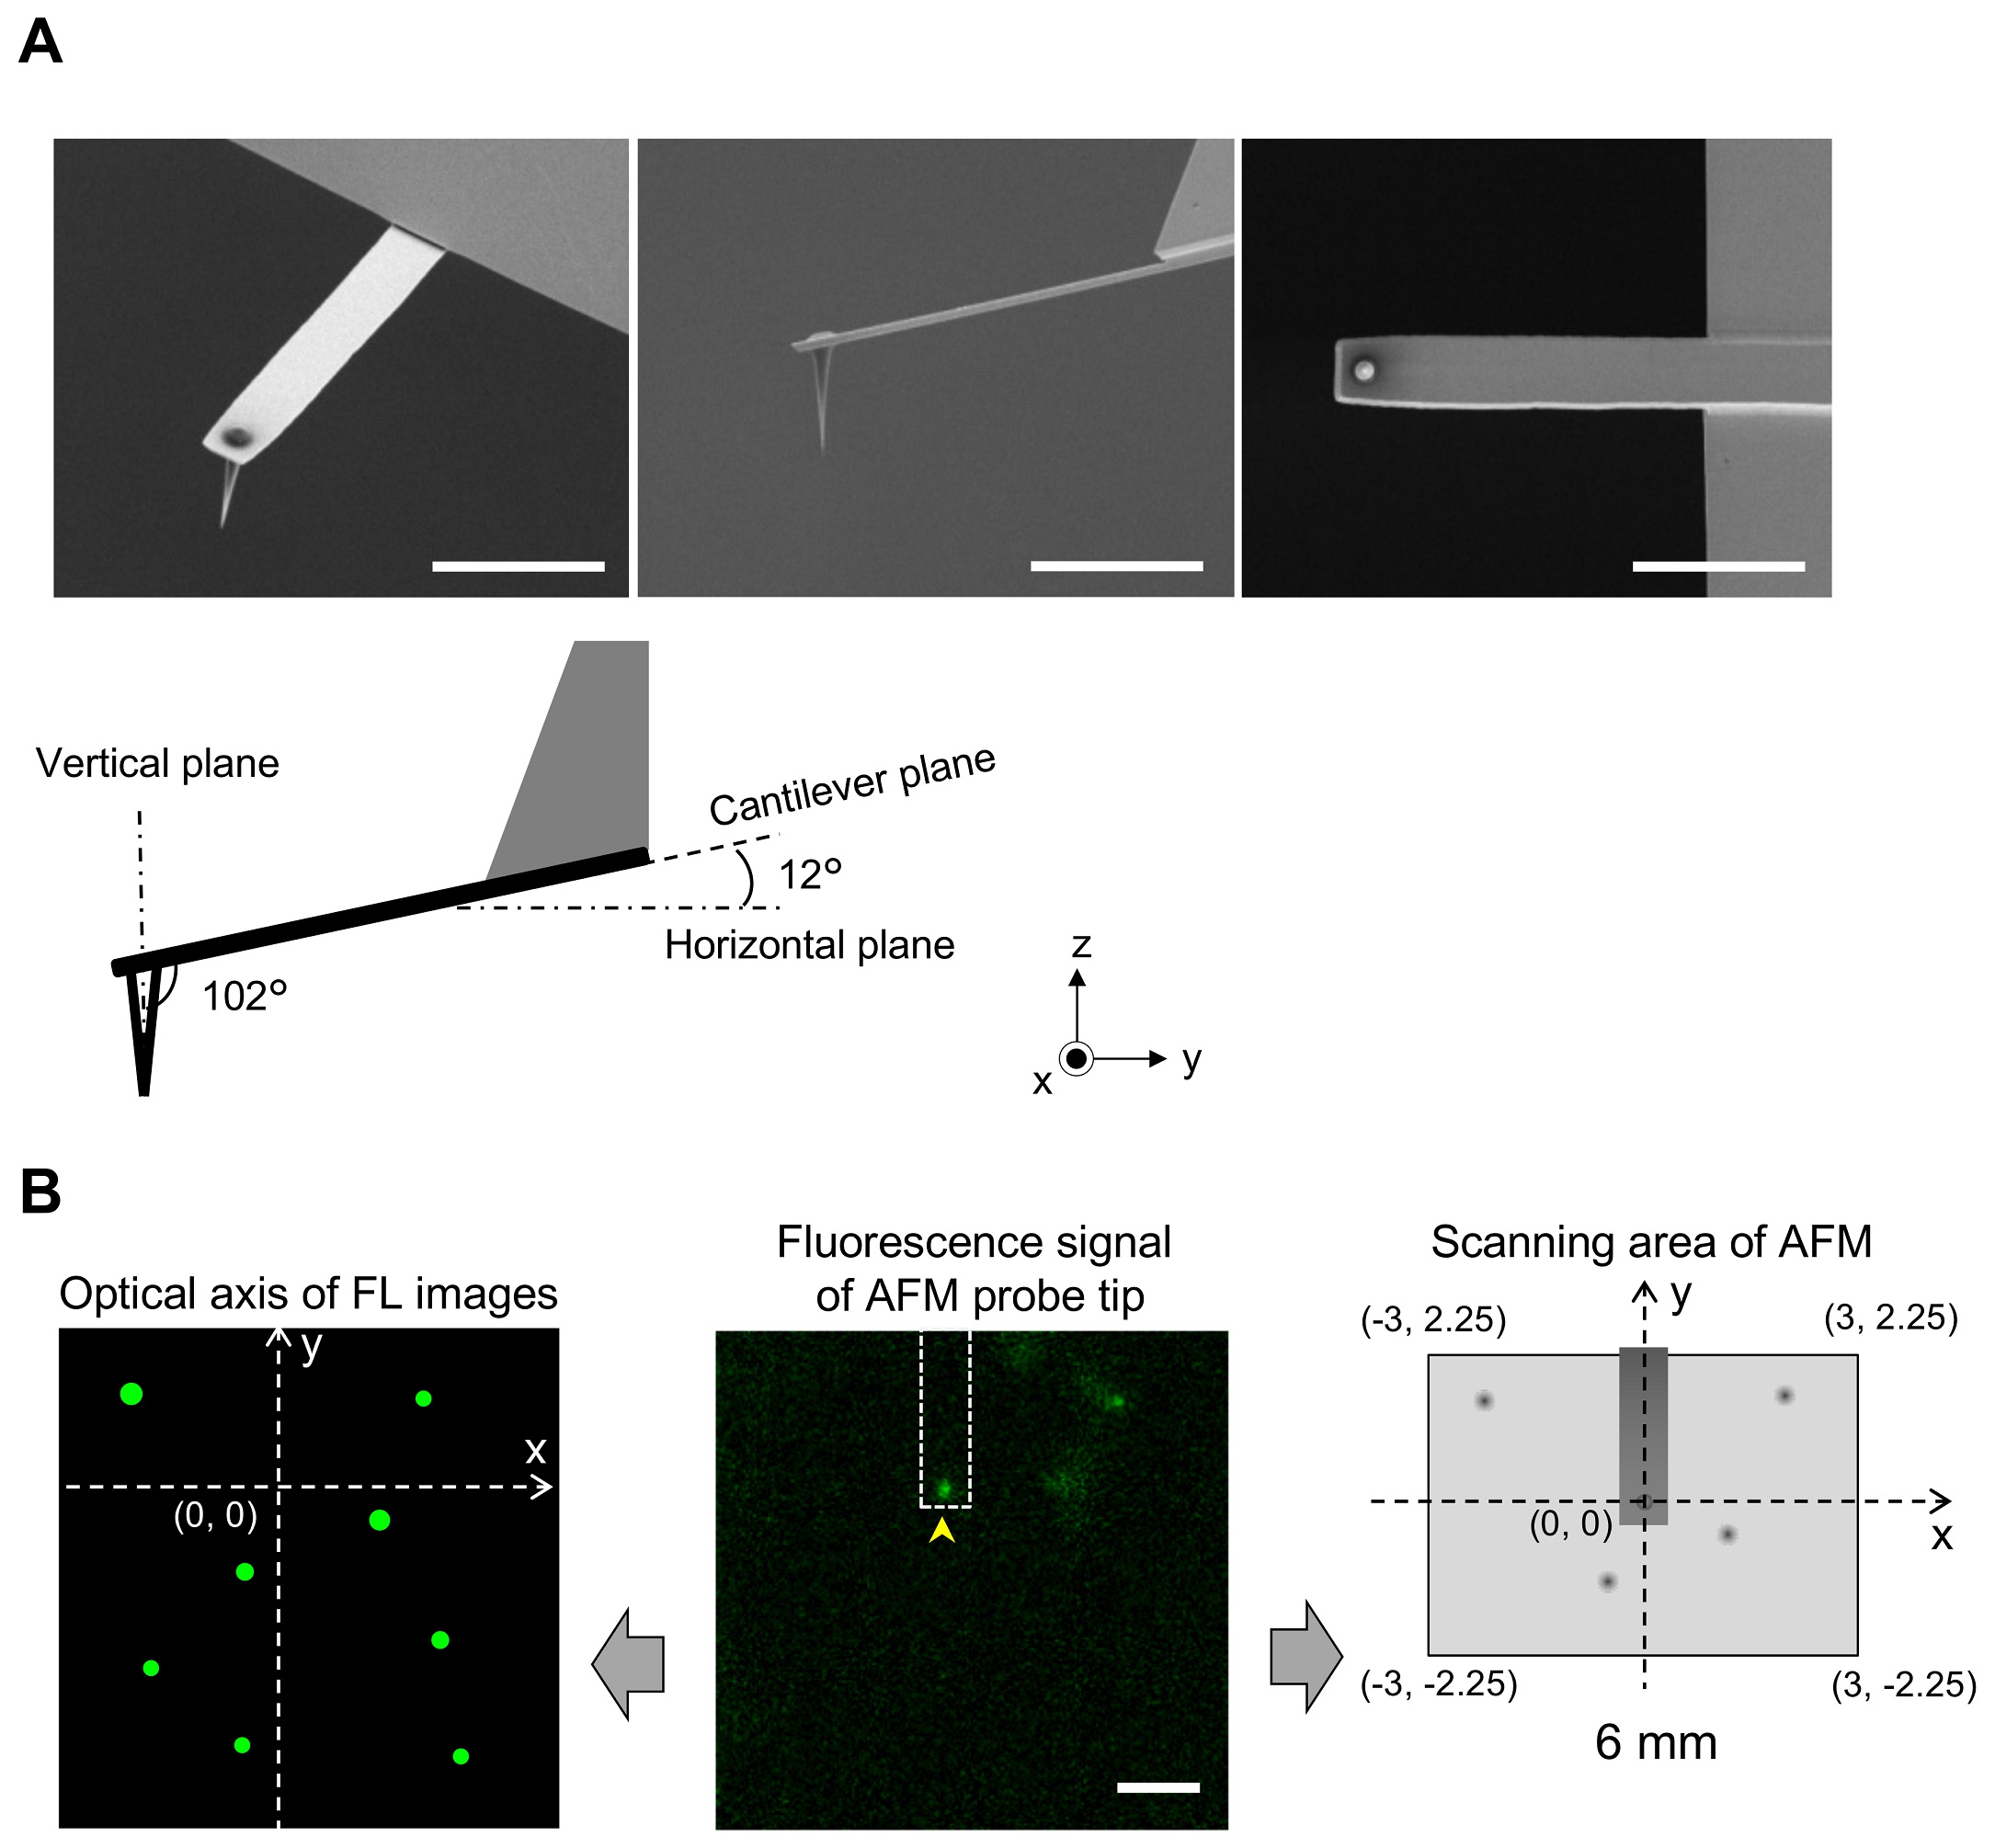
Supporting figure 1 from Aiko Yoshida et al 2018 “Morphological changes of plasma membrane and protein assembly during clathrin-mediated endocytosis”: 1 Fig. Aligning confocal and AFM images. (A) Scanning electron microscopy (SEM) images of a cantilever equipped with an EBD tip with tilt angle of 12°. Scale bar, 5 μm. Note that the cantilever is held on the AFM head unit with a tilt angle of 102° (from the x-y plane) so that the relative tip–sample angle (θ) is 90°. This setup makes it possible to precisely determine the position of the AFM tip. Scale bar, 2 μm. (B) Determining the position of the AFM probe in a fluorescence image. While the AFM probe was attached on the glass surface without scanning, the autofluorescence signal of the probe was imaged by the confocal scanning unit. The observed fluorescence spot (arrowhead in the middle panel) is defined as an origin of the fluorescence image plane (x = 0, y = 0) and used to define the optical axis (left panel). The position of a fluorescence spot derived from EGFP-CLCa was determined on this axis. On the other hand, the scanning area of the AFM scanner covers the area of (−3, 2.25) (left top), (3, 2.25) (right top), (3, −2.25) (right bottom), and (−3, −2.25) (left bottom) (all right panel). By aligning the axis from both images, the x, y position of the AFM image and that of the confocal fluorescence image could be merged. AFM, atomic force microscopy; EBD, electron beam–deposited; EGFP, enhanced green fluorescent protein; EGFP-CLCa, EGFP-fused clathrin light chain a. https://doi.org/10.1371/journal.pbio.2004786.s001
*Aiko Yoshida, Nobuaki Sakai, Yoshitsugu Uekusa, Yuka Imaoka, Yoshitsuna Itagaki, Yuki Suzuki and Shige H. Yoshimura Morphological changes of plasma membrane and protein assembly during clathrin-mediated endocytosis
PLoS Biol 16(5) (2018): e2004786
DOI: https://doi.org/10.1371/journal.pbio.2004786
The article “Morphological changes of plasma membrane and protein assembly during clathrin-mediated endocytosis” by Aiko Yoshida, Nobuaki Sakai, Yoshitsugu Uekusa, Yuka Imaoka, Yoshitsuna Itagaki, Yuki Suzuki and Shige H. Yoshimura is licensed under a Creative Commons Attribution 4.0 International License, which permits use, sharing, adaptation, distribution and reproduction in any medium or format, as long as you give appropriate credit to the original author(s) and the source, provide a link to the Creative Commons license, and indicate if changes were made. The images or other third-party material in this article are included in the article’s Creative Commons license, unless indicated otherwise in a credit line to the material. If material is not included in the article’s Creative Commons license and your intended use is not permitted by statutory regulation or exceeds the permitted use, you will need to obtain permission directly from the copyright holder. To view a copy of this license, visit https://creativecommons.org/licenses/by/4.0/.
Collagen is the most abundant structural protein in mammals. *
Type I collagen in its fibril form has a characteristic pattern structure that alternates two regions called gap and overlap. The structure and properties of collagens are highly dependent on the water and mineral content of the environment. *
In the article “Interfacial water on collagen nanoribbons by 3D AFM” Diana M. Arvelo, Clara Garcia-Sacristan, Enrique Chacón, Pedro Tarazona and Ricardo Garcia describe how they apply three dimensional atomic force microscopy (3D AFM) to characterize at angstrom-scale resolution the interfacial water structure of collagen nanoribbons.*
Three-dimensional AFM (3D AFM) is an AFM method developed for imaging at high-spatial resolution solid–liquid interfaces in the three spatial coordinates.*
This method has provided atomic-scale images of hydration and solvation layers on a variety of rigid and atomically flat surfaces, such as mica, gibbsite, boehmite, graphite, or 2D materials.*
However, imaging hydration layers on soft materials such as collagen is more challenging than on atomically flat crystalline surfaces.*
On the one hand, the force applied by the AFM tip might deform the protein. On the other hand, the height variations across gap and overlap regions might complicate the imaging of interfacial water.*
In recent years, 3D AFM has expanded its capabilities to image interfacial water on soft materials such as proteins, biopolymers, DNA, lipids, membrane proteins, and cells.*
Those experiments were performed with hydrophilic SiOx AFM tips which are negatively charged under neutral pH conditions.*
The imaging contrast mechanisms and the role of the AFM tip’s composition on the observed solvation structure are under discussion.*
More generally, both theory and experiments performed with very high salt concentrations indicated that the contrast observed in 3D AFM reflects an interplay between water particle and surface charge density distributions.*
For their article the authors apply 3D AFM to study at molecular-scale spatial resolution the structure of interfacial water on collagen nanoribbons.*
Diana M. Arvelo et al. study the influence of the AFM tip’s charge and the salt concentration on the interfacial solvent structure. They report that the interfacial structure depends on the water particle and ion charge density distributions. A non-charged AFM tip reveals the formation of hydration layers on both gap and overlap regions. A negatively charged AFM tip shows that on a gap region, the solvation structure might depart from that of the hydration layers. This effect is attributed to the adsorption of ions from the solution. Those ions occupy the voids existing between collagen molecules in the gap region. *
A home-made three-dimensional AFM was implemented on a commercially available AFM. 3D AFM was performed in the amplitude modulation mode by exciting the AFM cantilever at its first eigenmode.
At the same time when the AFM cantilever oscillates with respect to its equilibrium position, a sinusoidal signal is applied to the z-piezo to modify the relative z-distance between the sample and the AFM tip. *
Diana M. Arvelo et al. have used z-piezo displacements with amplitudes of 2.0 nm and a period (frequency) of 10 ms (100 Hz). The z-piezo signal is synchronized with the xy-displacements in such a way that for each xy-position on the surface of the material, the AFM tip performs a single and complete z-cycle. The z-data are read out every 10.24 µs and stored in 512 pixels (256 pixels per half cycle). Each xy-plane of the 3D map contains 80 × 64 pixels. Hence, the total time to acquire such a 3D-AFM image is 52 s.*
The 3D AFM experiments were performed with two types of AFM probes with different surface chemistries which have different chemical properties in aqueous solutions.*
The high-density carbon/diamond-like AFM tips grown on quartz-like AFM cantilevers that Diana M. Arvelo et al. et al used ( NanoWorld Ultra-Short CantileversUSC-F1.2-k7.3 for high-speed AFM) remain uncharged at pH 7.4 and are called “neutral” AFM tips in the article.
The silicon AFM cantilevers with silicon AFM tips (NanoWorld Arrow-UHFAuD ultra-high frequency AFM probes) are negatively charged at neutral pH (silicon tips for short in the text) and were used to observe the formation of collagen nanoribbons.
All silicon AFM tips are readily oxidized and are usually covered by a thin native oxide layer which is hydrophilic.
The hydroxyl groups on the surface of the silicon AFM tip become negatively charged while the carbon AFM tips remain neutral (unchanged).
To image at angstrom-scale resolution, the interfacial water structure on the collagen requires reducing the lateral and vertical imaging sizes, respectively, to 5 and 1.5 nm.*
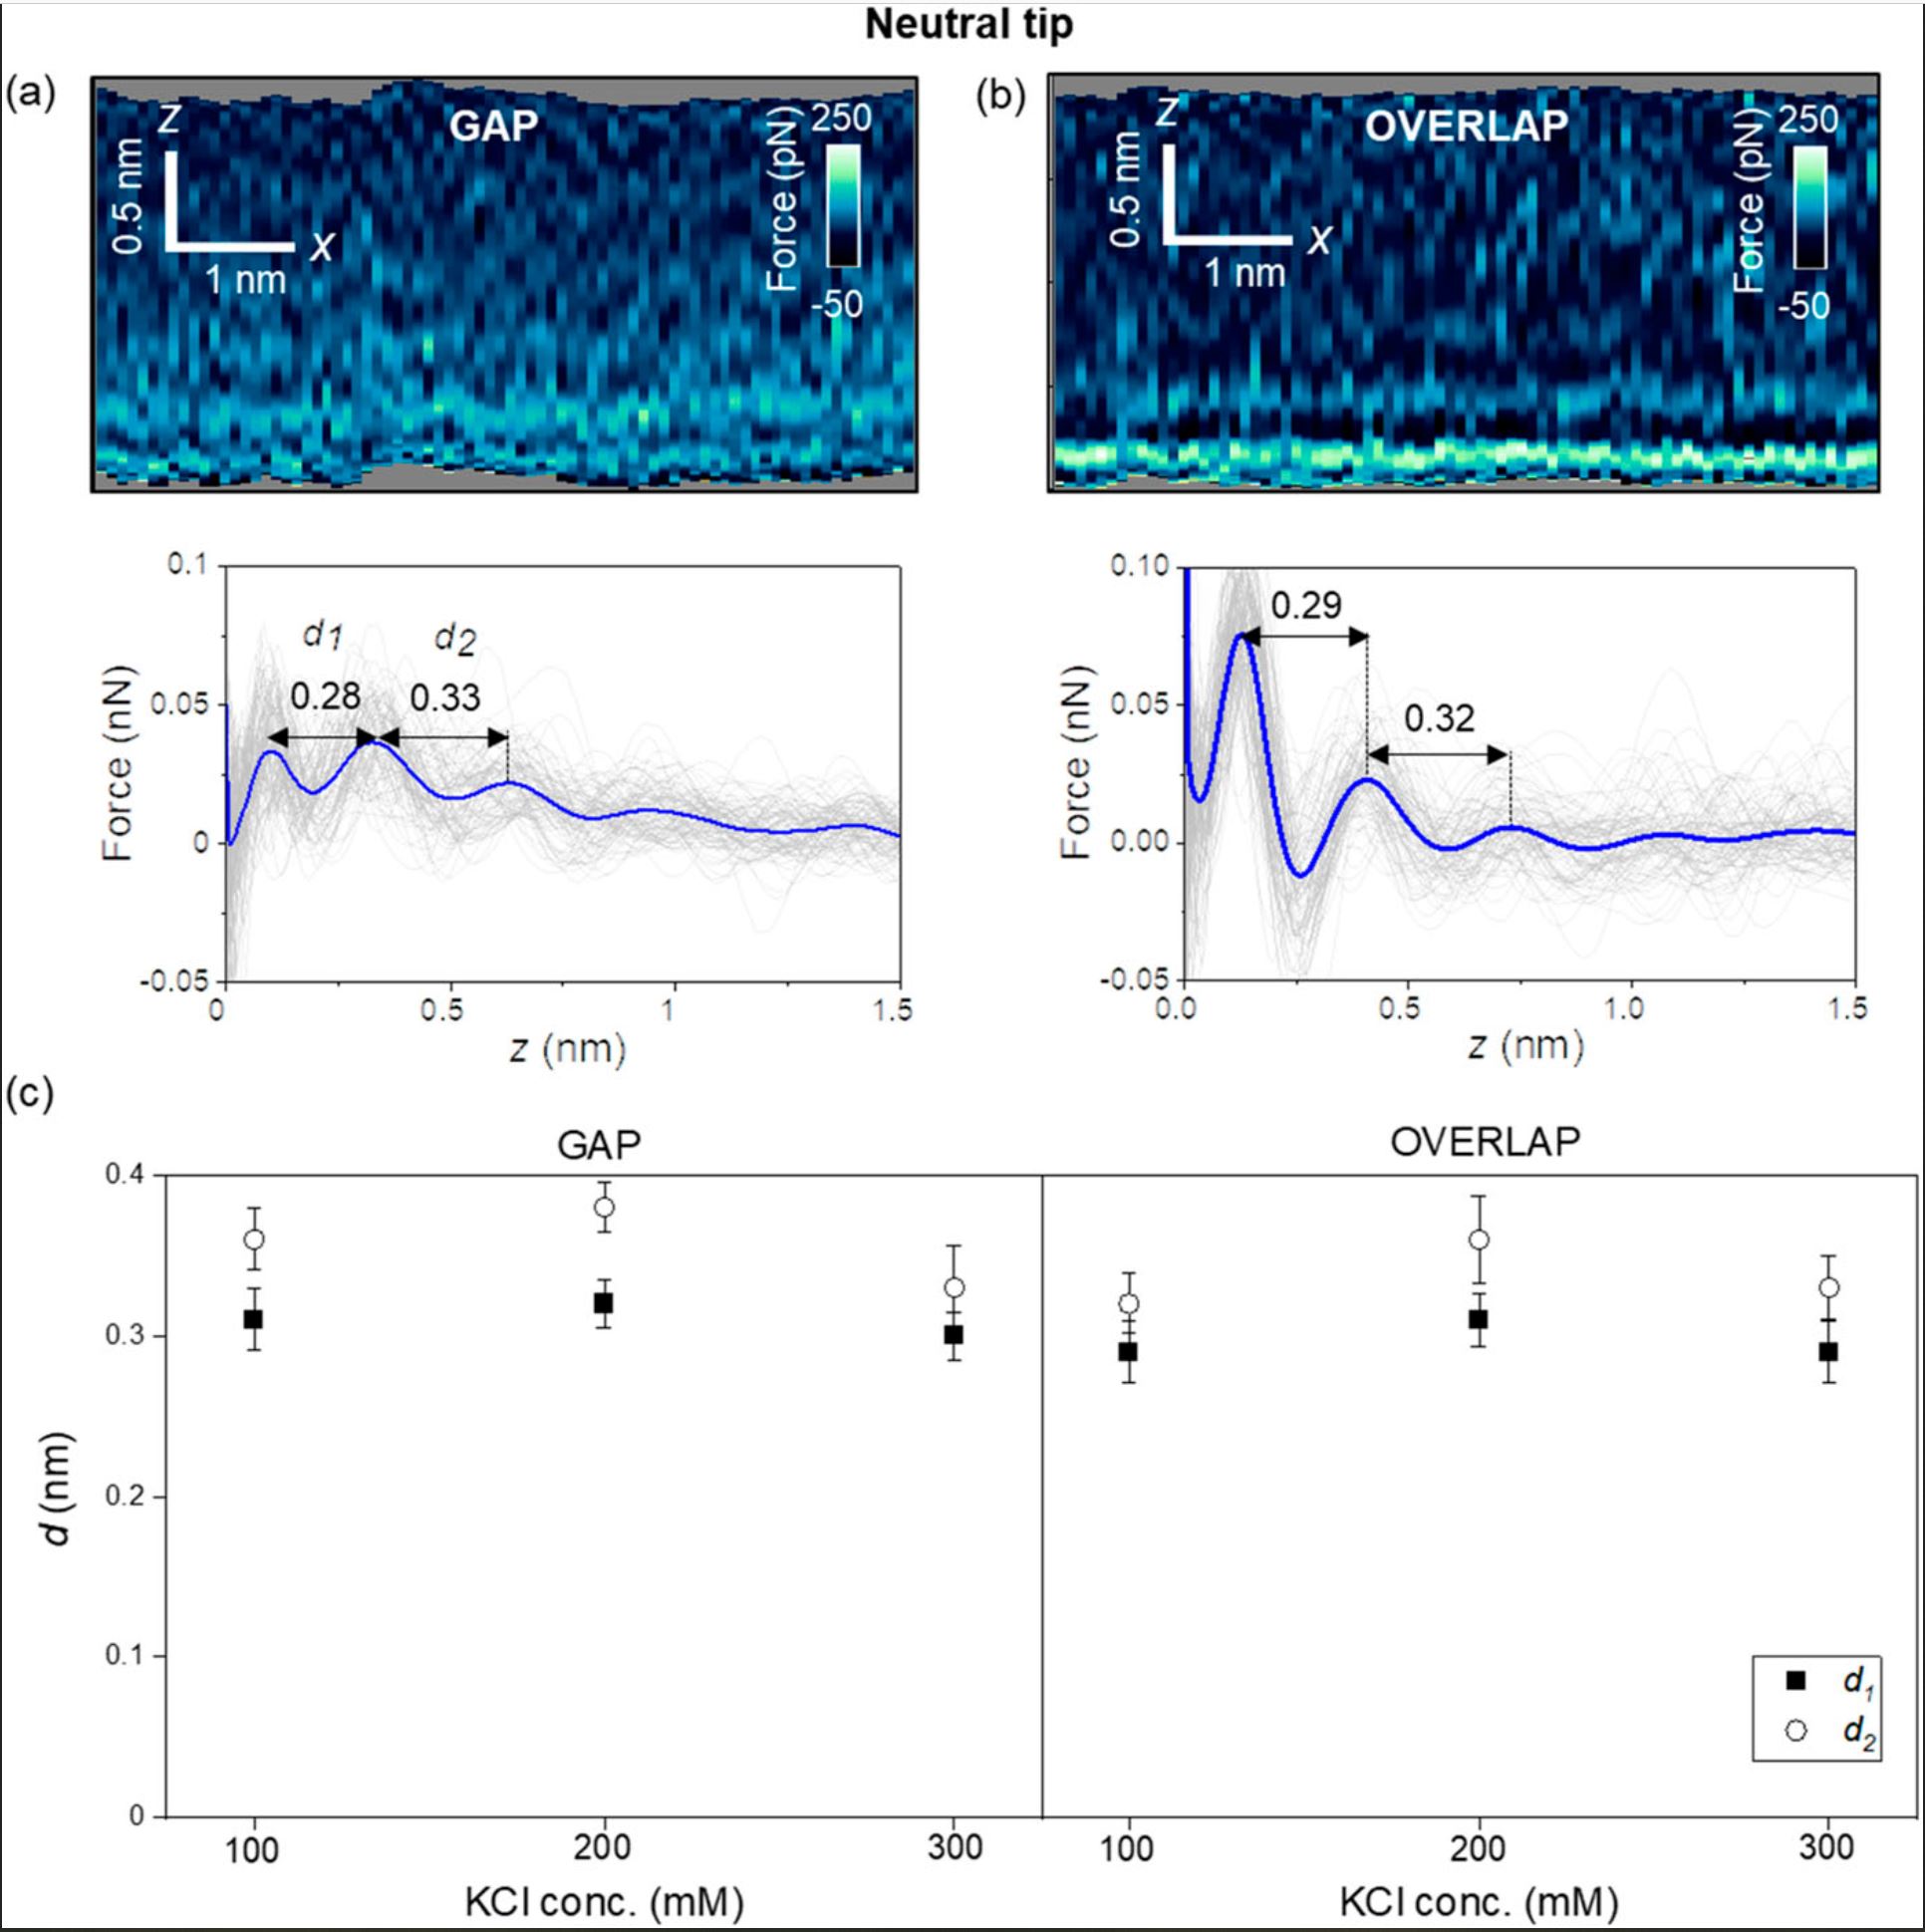
First, the authors introduce the results obtained with carbon-based tips (uncharged, NanoWorld Ultra-Short CantileversUSC-F1.2-k7.3 for high-speed AFM). Figure 2 (of the cited article) shows some representative 2D force xz panels obtained on gap and overlap regions of a collagen nanoribbon in a concentration of 300 mM KCl. The panels are extracted from a 3D AFM image. The interlayer distances in a gap region are d1 = 0.28 nm and d2 = 0.33 nm (average values) [Fig. 2(a)], while those in an overlap region are d1 = 0.29 and d2 = 0.32 nm (average values) [Fig. 2(b)]. Those values coincide within the experimental error with the values expected for hydration layers on hydrophilic surfaces.
Next, the authors repeated the experiment using other salt concentrations. Figure 2(c) shows that the interlayers distances (within the experimental error) do not depend on the salt concentration or the collagen region. Diana M. Arvelo et al. remark that entropic effects make the second layer more disordered than the first; therefore, d2 ≥ d1.
The structure and properties of collagens are highly dependent on the water and mineral content of the environment.
For a neutral AFM tip (USC-F1.2-k7.3), the interfacial water structure is characterized by the oscillation of the water particle density distribution with a value of 0.3 nm (hydration layers). The interfacial structure does not depend on the collagen region.
Hydration layers are observed in overlap regions, while in gap regions, the interfacial solvent structure is dominated by electrostatic interactions. These interactions generate interlayer distances of 0.2 nm.
The achieved results still need to be explained by the theory of 3D AFM. More detailed theoretical simulations, which are beyond the scope of the cited study, will be required to quantitatively explain the interlayer distances observed over gap regions.
However, the results presented by the authors highlight the potential of 3D AFM to identify the solvent structures on proteins and the complexity of those interfaces.*
Figure 2 from Diana M. Arvelo et al. 2024 “Interfacial water on collagen nanoribbons by 3D AFM” Interfacial liquid water structure on collagen provided by an uncharged tip. (a) 2D force maps (x, y) of the interfacial water structure in the gap region. The map is obtained in a 300 mM KCl solution. The force–distance curves in the bottom of the image are obtained from the top panel. (b) 2D force maps (x, y) of the interfacial water structure in the overlap region. The force–distance curves in the bottom of the image are obtained from the top panel. (c) Statistics of d1 and d2 distances measured from several collagen–water interfaces. The individual force–distance curves from the bottom panels of (a) and (b) are plotted in gray. The average force–distance curve is highlighted by a thick continuous line. The experiments are performed with USC-F1.2-k7.3 cantilevers. Experimental parameters: f = 745 kHz; k = 6.7 N m−1; Q = 8.3; A0 = 150 pm; Asp = 100 pm.
Figure 3 from Diana M. Arvelo et al. 2024 “Interfacial water on collagen nanoribbons by 3D AFM” Interfacial liquid water structure on collagen provided by a negatively charged tip. (a) 2D force maps (x, y) of the interfacial water structure in the gap region. The map is obtained in a 300 mM KCl solution. The force–distance curves in the bottom of the image are obtained from the top panel. (b) 2D force maps (x, y) of the interfacial water structure in the overlap region. The force–distance curves in the bottom of the image are obtained from the top panel. (c) Statistics of d1 and d2 distances measured from several collagen–water interfaces. In the bottom panels of (a) and (b), the individual force–distance curves from the bottom panels of (a) and (b) are plotted in gray. The average force–distance curve is highlighted by a thick continuous line. The images were captured using ArrowUHF AuD cantilevers. Experimental parameters: f = 745 kHz; k = 8.3 N m−1; Q = 4.5; A0 = 170 pm; Asp = 100 pm.
*Diana M. Arvelo, Clara Garcia-Sacristan, Enrique Chacón, Pedro Tarazona and Ricardo Garcia Interfacial water on collagen nanoribbons by 3D AFM
Journal of Chemical Physics 160, 164714 (2024)
DOI: https://doi.org/10.1063/5.0205611
The article “Interfacial water on collagen nanoribbons by 3D AFM” by Diana M. Arvelo, Clara Garcia-Sacristan, Enrique Chacón, Pedro Tarazona and Ricardo Garcia is licensed under a Creative Commons Attribution 4.0 International License, which permits use, sharing, adaptation, distribution and reproduction in any medium or format, as long as you give appropriate credit to the original author(s) and the source, provide a link to the Creative Commons license, and indicate if changes were made. The images or other third-party material in this article are included in the article’s Creative Commons license, unless indicated otherwise in a credit line to the material. If material is not included in the article’s Creative Commons license and your intended use is not permitted by statutory regulation or exceeds the permitted use, you will need to obtain permission directly from the copyright holder. To view a copy of this license, visit https://creativecommons.org/licenses/by/4.0/.