Structural and optical variation of pseudoisocyanine aggregates nucleated on DNA substrates

The ability to maximize the range of exciton transport while minimizing energy loss has significant implications for the design of future nanoscale light harvesting, optoelectronic, and sensing applications. *

One method of achieving this would be to densely pack dyes into strongly coupled aggregates such that excitations can be coherently delocalized through the partial or full length of the aggregate. *

Coherently coupled aggregates enable exciton migration over discreet spatial distances with near unitary quantum efficiency. As a result, controlled dye aggregation has long been studied by chemists as a method of tuning the photonic and physical properties of the dyes and pigments in light harvesting devices. An example of this coherent coupling phenomenon can be observed in the cyanine dye family and specifically the prototypical example, pseudoisocyanine (PIC) dye. *

In the article «Structural and optical variation of pseudoisocyanine aggregates nucleated on DNA substrates” Matthew Chiriboga, Christopher M Green, Divita Mathur, David A Hastman, Joseph S Melinger, Remi Veneziano, Igor L Medintz and Sebastián A Díaz show that DNA-nucleated PIC aggregates have properties which correlate to different molecular structures and are directed by changing the DNA scaffold. *

To achieve this, they formed PIC aggregates through heterogeneous nucleation by mixing dissolved PIC dye with various DNA nanostructures ranging from a rigid DX-tile to more flexible DNA duplex (dsDNA) or single strand DNA oligonucleotide (ssDNA). *

Although the aggregates Matthew Chiriboga et al formed required elevated excess of PIC dye relative to previously reported J-bits, they exhibited sharper and brighter fluorescence peaks as well as longer Ncoh. *

Therefore, the authors refer to aggregates formed by this approach as super aggregate (SA) in their article, though they note SA formed with different DNA substrates result in unique properties. *

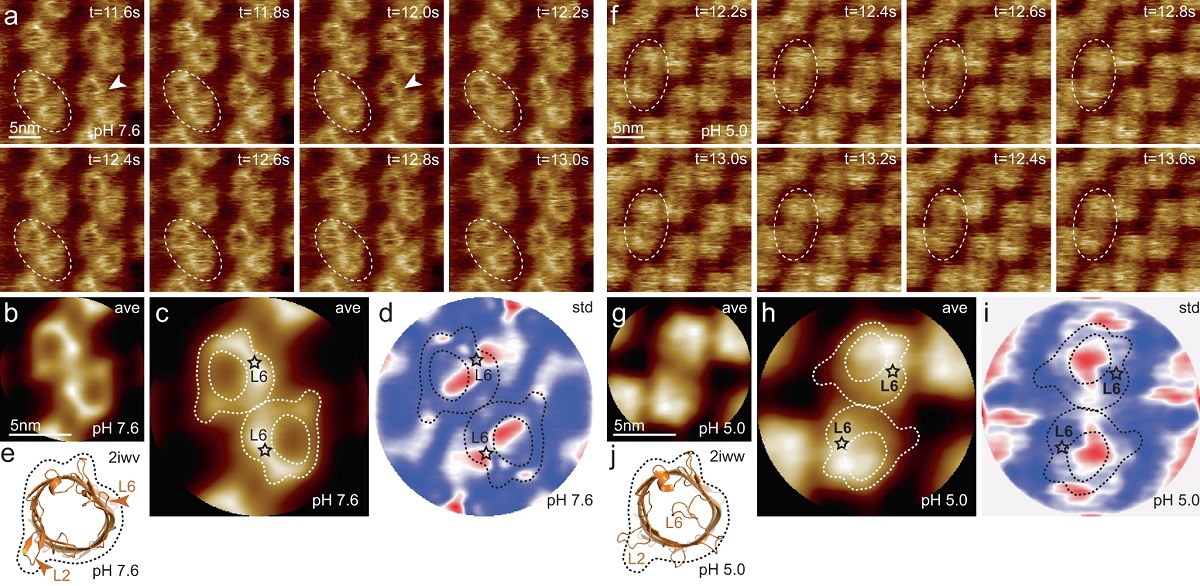
Complementary circular dichroism (CD) and atomic force microscopy (AFM) characterizations were used to analyze the SA and both indicated distinctions in the way each substrate and subsequent dye aggregate incorporates the individual PIC molecules. *

To achieve high resolution imaging of nucleic acid nanostructures, the DNA is often deposited onto a mica substrate, where mica electrostatically binds the DNA. Once deposited onto the mica, the imaging can be done in a hydrated environment as there is no additional required dehydration or staining of the DNA, a particularly convenient advantage of AFM. *

The AFM imaging was performed under AC fast imaging mode (liquid) with NanoWorld  Ultra-Short Cantilevers (USC) for Fast/High-Speed AFM of the USC-F0.3-k0.3 AFM probe type.*

On a segment of freshly cleaved mica mounted to a magnetic puck, 15 μl of PIC-DANN solution was deposited immediately before measurement. A 25 μl droplet of imaging buffer was deposited on the AFM tip, then the AFM tip mount was lowered into the sample buffer to create a liquid ‘chamber’ for imaging. *

When introducing various DNA scaffolds for SA formation and subsequent AFM imaging, Matthew Chiriboga et al. observed significant changes in the aggregates structure. *

The AFM imaging highlighted the stark differences in aggregate formation resulting from the DNA substrates. *

To the author’s knowledge this is the first visualization of DNA-based PIC aggregates. Results from the field have been pointing towards fiber-like or nanotube-like networks of polymerized PIC as a structural model for aggregates suspended in solution. *

On the other hand, other AFM studies demonstrate that PIC aggregates formed on mica substrates adopt a leafy island morphology. *

Interestingly, Matthew Chiriboga et al. observe evidence of both PIC fibers as well as leafy islands that exhibit distinct growth patterns, again depending on the DNA substrate. *

Although this work contributes to the growing body of evidence that solution-based PIC aggregates form fibrous networks structures, the AFM measurements presented in the article highlight the multiplicity of PIC aggregation modes when introduced to DNA scaffolds. *

The results presented in the research article suggest modification of the DNA substrate results in significant changes to how the DNA and companion dye molecules are integrated into larger form PIC aggregates. *

Bearing in mind that the broader motivation for studying DNA based PIC aggregates is to integrate strongly coupled dyes onto modular DNA structural units, PIC SAs should be given due consideration as a versatile option. *

In fact, similar work is being done with other cyanine dyes where DNA template modification is used to switch between quenching and energy transfer. *

Ultimately this could be a path for the PIC SA and one which possibly leads towards applications in optical microcavities for quantum electrodynamical devices and optical switching, molecular plasmonics, biosensors, and light-harvesting arrays. *

Figure 6 from Matthew Chiriboga et al. “Structural and optical variation of pseudoisocyanine aggregates nucleated on DNA substrates”:Atomic Force Microscopy visualisation of pseudoisocyanine aggregates – super aggregates (SA) nucleated on DNA substrates. AFM visualizations of pseudoisocyanine (PIC) aggregates formed in the (A) AT, (B) dsDNA, and (C) ssDNA nanostructures. Each of the samples was formed immediately before measurement by mixing 160 μM PIC dye with 500 nM DNA normalized to the dye-labeled strand concentration (i.e. 320-fold excess). When the SA was formed using an AT DX-tile template (figures 6(A) the authors observed the formation of large and long rod-like aggregates with a relatively isotropic growth axis. This supports the hypothesis proposed by Yoa et al which suggested aggregation along preferential axis due to a preferred interaction between the PIC and the mica NanoWorld USC-F0.3-k0.3 AFM probes were used for the under AC fast imaging mode in liquid.
Figure 6 from Matthew Chiriboga et al. “Structural and optical variation of pseudoisocyanine aggregates nucleated on DNA substrates”:
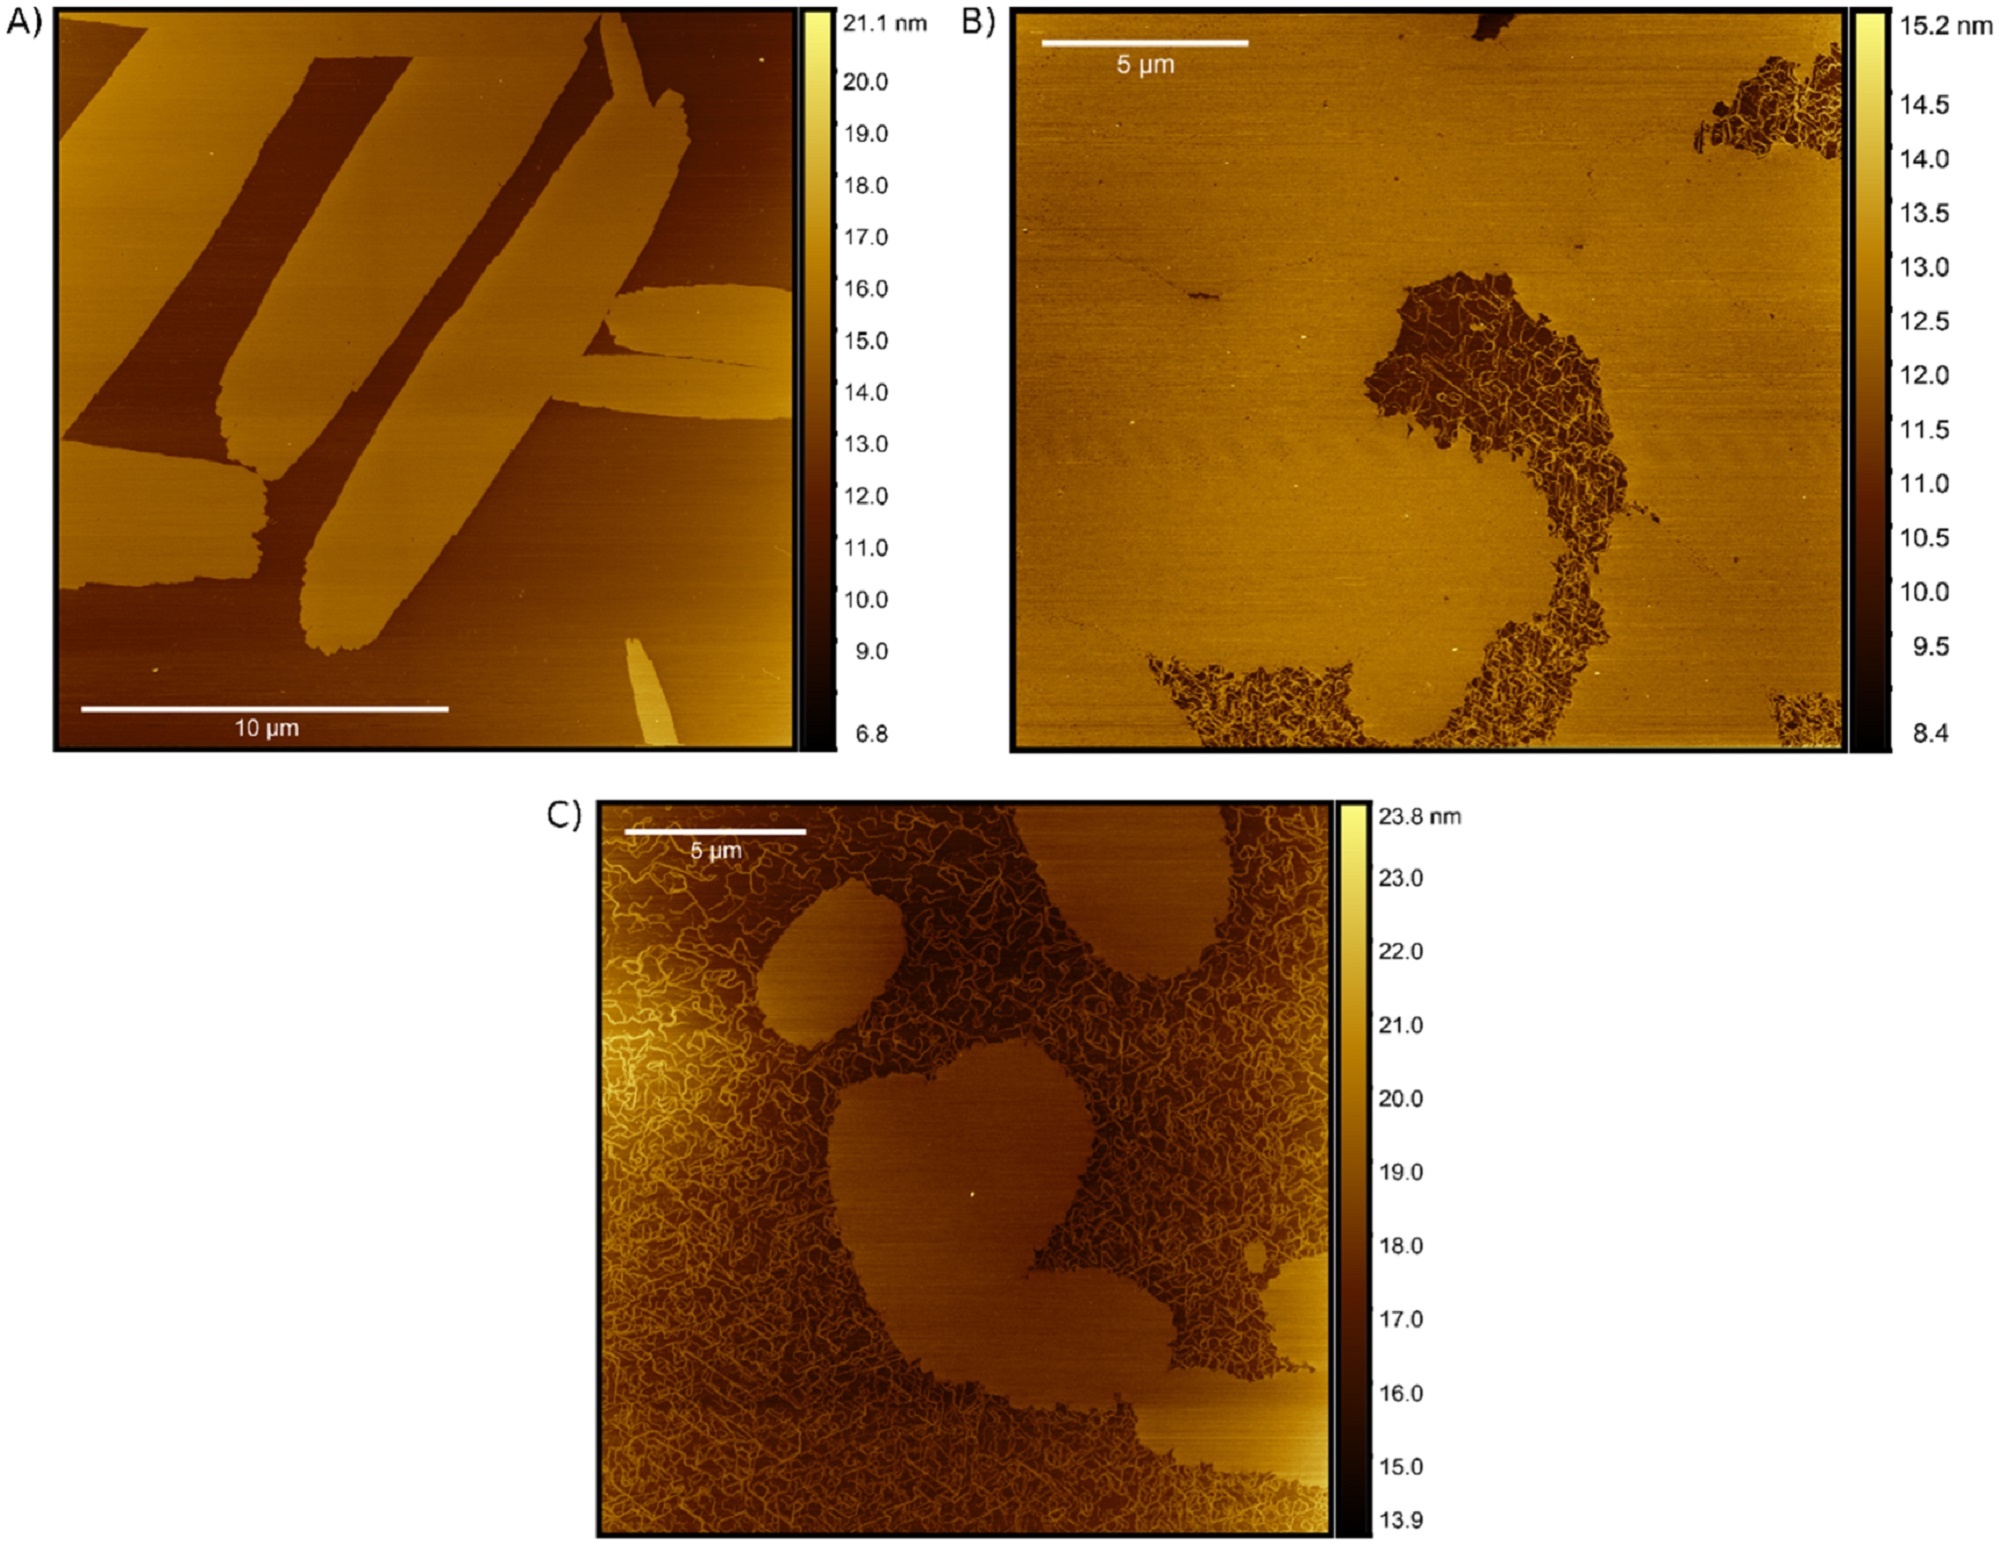
AFM visualization of SA formations. AFM visualizations of PIC aggregates formed in the (A) AT, (B) dsDNA, and (C) ssDNA nanostructures. Each of the samples was formed immediately before measurement by mixing 160 μM PIC dye with 500 nM DNA normalized to the dye-labeled strand concentration (i.e. 320-fold excess).

*Matthew Chiriboga, Christopher M Green, Divita Mathur, David A Hastman, Joseph S Melinger, Remi Veneziano, Igor L Medintz and Sebastián A Díaz
Structural and optical variation of pseudoisocyanine aggregates nucleated on DNA substrates
Methods and Applications in Fluorescence (2023) 11 014003
DOI: https://doi.org/10.1088/2050-6120/acb2b4

The article “Active self-assembly of piezoelectric biomolecular films via synergistic nanoconfinement and in-situ poling” by Matthew Chiriboga, Christopher M Green, Divita Mathur, David A Hastman, Joseph S Melinger, Remi Veneziano, Igor L Medintz and Sebastián A Díaz is licensed under a Creative Commons Attribution 4.0 International License, which permits use, sharing, adaptation, distribution and reproduction in any medium or format, as long as you give appropriate credit to the original author(s) and the source, provide a link to the Creative Commons license, and indicate if changes were made. The images or other third-party material in this article are included in the article’s Creative Commons license, unless indicated otherwise in a credit line to the material. If material is not included in the article’s Creative Commons license and your intended use is not permitted by statutory regulation or exceeds the permitted use, you will need to obtain permission directly from the copyright holder. To view a copy of this license, visit https://creativecommons.org/licenses/by/4.0/.

Correlation of membrane protein conformational and functional dynamics

Membrane proteins (MPs) reside in the plasma membrane and perform various biological processes including ion transport, substrate transport, and signal transduction.*

Function-related conformational changes in membrane proteins occur in times scales ranging from nanoseconds to seconds.*

Obtaining time-resolved dynamic information of MPs in their membrane environment is still a major challenge.*

Although High Speed Atomic Force Microscopy (HS-AFM) images label-free samples such as DNA, soluble proteins, MPs, and intrinsically disordered proteins at ~1n~m lateral, ~0.1 nm vertical and ~100 ms temporal solution in aqueous environment and at ambient temperature and pressure, its temporal resolution is too slow to characterize many dynamic biological processes.*

In order to overcome this limitation Raghavendar Reddy Sanganna Gari, Joel José Montalvo-Acosta, George R. Heath, Yining Jiang, Xiaolong Gao, Crina M. Nimigean, Christophe Chipot and Simon Scheuring in their article Correlation of membrane protein conformational and functional dynamics use High Speed Atomic Force Microscopy Height Spectroscopy ( HS-AFM-HS) to characterize the microsecond timescale conformational changes of an integral-MP model system, i.e., the outer membrane protein G (OmpG) in a membrane environment.*

The positioning of the AFM tip is guided by HS-AFM imaging immediately before HS-AFM-HS-operation.*

NanoWorld Ultra-Short Cantilevers (USC) of the USC-F1.2-k0.15 type were used for the HS-AFM and HS-AFM-HS presented in the article.*

Figure 1 from “Correlation of membrane protein conformational and functional dynamics” by R.R. Sanganna Gari et al:
HS-AFM imaging of OmpG in lipid bilayers at pH 7.6 and pH 5.0.
a OmpG at pH 7.6 (Supplementary movie 1, left; frame rate: 200 ms per frame). A OmpG dimer is highlighted with dashed outline in all frames. Arrowheads in t = 11.6 s: Loop-6 fluctuating over the lumen. Arrowhead in t = 12.0 s: Fully open state. b Correlation average (n = 2752) of the HS-AFM movie frames (344 frames recorded over 68.8 s, full color scale: 0.0 nm < height < 1.25 nm, where the membrane level was set to 0.0 nm). c Correlation average of OmpG dimers. The topography outline (based on the molecular structure in 1e), serves as a visual guide to locate loop-6 and loop-2 in the topography and is highlighted by the dashed outline (the position of loop-6 is indicated by the asterisk based on its location in the structure (e)). Inner dashed outline show barrel lumen. d Standard deviation (std) map (n = 2752) from the averaging process in (b) (full color scale from blue to red: 0.05 nm < std < 0.19 nm) and topography outlines as in (c). e X-ray structure (PDB 2iwv) of the open OmpG conformation. Loop-6 (arrowhead L6) stands out of the image plane towards the viewer. Loop-2 (L2) forms a beta strand pointing away from the β-barrel, well detected by HS-AFM in the open state (b). f OmpG at pH 5.0 (Supplementary movie 1, right; frame rate: 200 ms per frame). A OmpG dimer is highlighted with dashed outline in all frames. g Correlation average (n = 2472) of the HS-AFM movie frames (309 frames recorded over 61.8 s, full color scale: 0.0 nm < height < 0.7 nm, where the membrane level was set to 0.0 nm). h Correlation average of OmpG dimers. For comparison, the topography outline of the open state (e) is shown (the position of loop-6 is indicated by the asterisk). i Standard deviation (std) map (n = 2472) from the averaging process in (g) (full color scale from blue to red: 0.04 nm < std < 0.07 nm) and topography outlines as in (h). j X-ray structure (PDB 2iww) of the closed OmpG conformation shown in the same orientation as in (e). Loop-6 (L6) folds over the β-barrel lumen in a lid-like manner. Loop-2 (L2) does not form a β-strand in the closed state, in agreement with absence of topography in this region in (h). Black dashed line: outline based on (e) for comparison.
NanoWorld USC-F1.2-k0.15 AFM probes were used for the HS-AFM.
Figure 1 from “Correlation of membrane protein conformational and functional dynamics” by R.R. Sanganna Gari et al:
HS-AFM imaging of OmpG in lipid bilayers at pH 7.6 and pH 5.0.
a OmpG at pH 7.6 (Supplementary movie 1, left; frame rate: 200 ms per frame). A OmpG dimer is highlighted with dashed outline in all frames. Arrowheads in t = 11.6 s: Loop-6 fluctuating over the lumen. Arrowhead in t = 12.0 s: Fully open state. b Correlation average (n = 2752) of the HS-AFM movie frames (344 frames recorded over 68.8 s, full color scale: 0.0 nm < height < 1.25 nm, where the membrane level was set to 0.0 nm). c Correlation average of OmpG dimers. The topography outline (based on the molecular structure in 1e), serves as a visual guide to locate loop-6 and loop-2 in the topography and is highlighted by the dashed outline (the position of loop-6 is indicated by the asterisk based on its location in the structure (e)). Inner dashed outline show barrel lumen. d Standard deviation (std) map (n = 2752) from the averaging process in (b) (full color scale from blue to red: 0.05 nm < std < 0.19 nm) and topography outlines as in (c). e X-ray structure (PDB 2iwv) of the open OmpG conformation. Loop-6 (arrowhead L6) stands out of the image plane towards the viewer. Loop-2 (L2) forms a beta strand pointing away from the β-barrel, well detected by HS-AFM in the open state (b). f OmpG at pH 5.0 (Supplementary movie 1, right; frame rate: 200 ms per frame). A OmpG dimer is highlighted with dashed outline in all frames. g Correlation average (n = 2472) of the HS-AFM movie frames (309 frames recorded over 61.8 s, full color scale: 0.0 nm < height < 0.7 nm, where the membrane level was set to 0.0 nm). h Correlation average of OmpG dimers. For comparison, the topography outline of the open state (e) is shown (the position of loop-6 is indicated by the asterisk). i Standard deviation (std) map (n = 2472) from the averaging process in (g) (full color scale from blue to red: 0.04 nm < std < 0.07 nm) and topography outlines as in (h). j X-ray structure (PDB 2iww) of the closed OmpG conformation shown in the same orientation as in (e). Loop-6 (L6) folds over the β-barrel lumen in a lid-like manner. Loop-2 (L2) does not form a β-strand in the closed state, in agreement with absence of topography in this region in (h). Black dashed line: outline based on (e) for comparison.
Figure 2 from “Correlation of membrane protein conformational and functional dynamics” by R.R. Sanganna Gari et al:
Single channel electrophysiology and HS-AFM height spectroscopy recordings of OmpG in lipid bilayers.
Representative 60-ms segments of OmpG single channel recordings at pH 7.6 (a) and pH 5.0 (b) at +40 mV membrane potential (longer traces in Supplementary Figs. 2 and 3). Cartoon representation of single channel recording experimental setup is shown in inset of (a). OmpG (yellow) in open state (PDB:2IWV) is placed in a lipid bilayer (green) surrounded by buffer (light blue shade) and potassium and chloride ions are shown as red and blue spheres. Red arrow indicates ion flow through OmpG in response to voltage application. Dwell time histograms of open and closed states at pH 7.6 (c) and pH 5.0 (d) from single-channel recordings (see Supplementary Table 1). Representative 60-ms segments of OmpG HS-AFM-HS recordings at pH 7.6 (e) and pH 5.0 (f) (longer traces in Supplementary Fig. 4). Cartoon representation of HS-AFM height spectroscopy experimental setup is shown in inset of (e). An oscillating AFM tip (orange) detects conformational changes of loop motion. Dwell time histograms of open and closed states at pH 7.6 (g) and pH 5.0 (h) from HS-AFM-HS recordings (Supplementary Table 2). In HS-AFM-HS the low state represents the open state, where the HS-AFM tip can descend into the β-barrel, and the high state represents the closed state, where loop-6 covers the beta barrel barring access of the HS-AFM tip to the cavity. All current-time and height-time traces were filtered at 20 kHz during analysis. The state dwell-time histograms are shown using log binning for better visualization of the components49. Red traces in (a) and (b) represent idealized current-time traces using clampfit software. Red traces in (e) and (f) represent idealized height-time traces using the STaSI algorithm (see Methods).
NanoWorld USC-F1.2-k0.15 AFM probes were used for the HS-AFM-HS.
Figure 2 from “Correlation of membrane protein conformational and functional dynamics” by R.R. Sanganna Gari et al:
Single channel electrophysiology and HS-AFM height spectroscopy recordings of OmpG in lipid bilayers.
Representative 60-ms segments of OmpG single channel recordings at pH 7.6 (a) and pH 5.0 (b) at +40 mV membrane potential (longer traces in Supplementary Figs. 2 and 3). Cartoon representation of single channel recording experimental setup is shown in inset of (a). OmpG (yellow) in open state (PDB:2IWV) is placed in a lipid bilayer (green) surrounded by buffer (light blue shade) and potassium and chloride ions are shown as red and blue spheres. Red arrow indicates ion flow through OmpG in response to voltage application. Dwell time histograms of open and closed states at pH 7.6 (c) and pH 5.0 (d) from single-channel recordings (see Supplementary Table 1). Representative 60-ms segments of OmpG HS-AFM-HS recordings at pH 7.6 (e) and pH 5.0 (f) (longer traces in Supplementary Fig. 4). Cartoon representation of HS-AFM height spectroscopy experimental setup is shown in inset of (e). An oscillating AFM tip (orange) detects conformational changes of loop motion. Dwell time histograms of open and closed states at pH 7.6 (g) and pH 5.0 (h) from HS-AFM-HS recordings (Supplementary Table 2). In HS-AFM-HS the low state represents the open state, where the HS-AFM tip can descend into the β-barrel, and the high state represents the closed state, where loop-6 covers the beta barrel barring access of the HS-AFM tip to the cavity. All current-time and height-time traces were filtered at 20 kHz during analysis. The state dwell-time histograms are shown using log binning for better visualization of the components49. Red traces in (a) and (b) represent idealized current-time traces using clampfit software. Red traces in (e) and (f) represent idealized height-time traces using the STaSI algorithm (see Methods).

*Raghavendar Reddy Sanganna Gari, Joel José Montalvo-Acosta, George R. Heath, Yining Jiang, Xiaolong Gao, Crina M. Nimigean, Christophe Chipot and Simon Scheuring
Correlation of membrane protein conformational and functional dynamics
Nature Communications volume 12, Article number: 4363 (2021)
DOI: https://doi.org/10.1038/s41467-021-24660-1

Please follow this external link to read the full article: https://rdcu.be/cAE2S

Open Access : The article “Correlation of membrane protein conformational and functional dynamics” by Raghavendar Reddy Sanganna Gari, Joel José Montalvo-Acosta, George R. Heath, Yining Jiang, Xiaolong Gao, Crina M. Nimigean, Christophe Chipot and Simon Scheuring is licensed under a Creative Commons Attribution 4.0 International License, which permits use, sharing, adaptation, distribution and reproduction in any medium or format, as long as you give appropriate credit to the original author(s) and the source, provide a link to the Creative Commons license, and indicate if changes were made. The images or other third party material in this article are included in the article’s Creative Commons license, unless indicated otherwise in a credit line to the material. If material is not included in the article’s Creative Commons license and your intended use is not permitted by statutory regulation or exceeds the permitted use, you will need to obtain permission directly from the copyright holder. To view a copy of this license, visit https://creativecommons.org/licenses/by/4.0/.

Millisecond dynamics of an unlabeled amino acid transporter

Excitatory amino acid transporters (EAATs) are important in many physiological processes and crucial for the removal of excitatory amino acids from the synaptic cleft.*

In the article “Millisecond dynamics of an unlabeled amino acid transporter “ Tina R. Matin, George R. Heath, Gerard H. M. Huysmans, Olga Boudker and Simon Scheuring develop and apply high-speed atomic force microscopy line-scanning (HS-AFM-LS) combined with automated state assignment and transition analysis for the determination of transport dynamics of unlabeled membrane-reconstituted GltPh, a prokaryotic EAAT homologue, with millisecond temporal resolution.*

Among the bulk and single-molecule techniques, high-speed atomic force microscopy ( HS-AFM ) stands out with its ability to provide real-time structural and dynamical information of single molecules. HS-AFM images label-free molecules under close-to-physiological conditions with ~0.1 nm vertical and ~1 nm lateral imaging resolution. Furthermore, HS-AFM has typically ~100 ms temporal resolution, giving access to structure–dynamics relationship of proteins, though the achievable imaging speed depends on sample characteristics like scan size and surface corrugation.

Recently in a quest to achieve higher temporal resolutions, the authors of the cited article used HS-AFM line scanning (HS-AFM-LS) for the analysis of single-protein dynamics. *

Line scanning, using a conventional AFM, has been used to study protein–protein interactions earlier. In HS-AFM-LS, the slow-scan axis (y-direction) is disabled. Therefore, instead of imaging an x/y-area, the scientists scan over one horizontal x-line several hundreds to thousands of times per second, thus reaching millisecond temporal resolution. The topographical readouts of this line are stacked one after another, resulting in kymographs of the dynamical behavior of the molecules. Therefore, HS-AFM-LS has between 2 and 3 orders of magnitude higher temporal resolution than HS-AFM imaging and should allow the detection of fast transporter dynamics and possible intermediate states that have so far escaped kinetic characterization. *

All AFM images presented in this study were taken using a HS-AFM operated in amplitude modulation mode (with typical free and setpoint amplitudes, Afree = 1.0 nm and Aset = 0.9 nm, respectively using optimized scan and feedback parameters. NanoWorld Ultra-Short Cantilevers ( NanoWorld’s AFM probe series especially dedicated for High Speed Scanning) of the USC-F1.2-k0.15 type were used. In the presented experiments, four different buffer conditions were used. *

As the authors state in their article they find that GltPh transporters can operate much faster than previously reported, with state dwell-times in the 50 ms range, and report the kinetics of an intermediate transport state with height between the outward- and inward-facing states. Transport domains stochastically probe transmembrane motion, and reversible unsuccessful excursions to the intermediate state occur. The presented approach and analysis methodology are generally applicable to study transporter kinetics at system-relevant temporal resolution.*

Figure 2 from “Millisecond dynamics of an unlabeled amino acid transporter” by Tina R. Matin et al.
HS-AFM line scanning (HS-AFM-LS): millisecond temporal resolution of unlabeled transporter dynamics.:
a HS-AFM image of a membrane packed with GltPh exposing the extracellular face before HS-AFM-LS (apo condition: 20 mM Tris-HCl, pH7.5, 150 mM KCl). Dashed lines indicate the position of the central scan line where subsequent HS-AFM-LS is performed. b Six seconds of a HS-AFM-LS kymograph with 3.3 ms line acquisition speed. Each transporter domain appears as a vertical line. c Projection (top) and height profile (bottom) of b. d HS-AFM image after HS-AFM-LS. The lateral position of recognizable features in a–d are indicated by arrowheads. e One second high-magnification views of dashed regions 1, 2, and 3 in b. Transport domain excursions to the inward-facing state appear as dark dwells along the vertical time axis. f Projection (top) and height profile (bottom) of e. Arrowheads indicate the position of the seven protomers in the kymograph (red: active protomer #5). g Height/time traces (gray) and state fits (red) of the active domain (protomer #5) in e. This figure is representative of the experimental sequence for the >50 replicates analyzed in this work.
NanoWorld Ultra-Short Cantilevers ( NanoWorld's AFM probe series especially dedicated for High Speed Scanning) of the USC-F1.2-k0.15 type (8 μm length, nominal spring constant of 0.15 N/m, nominal resonance frequency of ∼650 kHz and quality factor of ∼1.5 in buffer) were used.
Figure 2 from “Millisecond dynamics of an unlabeled amino acid transporter” by Tina R. Matin et al.
HS-AFM line scanning (HS-AFM-LS): millisecond temporal resolution of unlabeled transporter dynamics.:
a HS-AFM image of a membrane packed with GltPh exposing the extracellular face before HS-AFM-LS (apo condition: 20 mM Tris-HCl, pH7.5, 150 mM KCl). Dashed lines indicate the position of the central scan line where subsequent HS-AFM-LS is performed. b Six seconds of a HS-AFM-LS kymograph with 3.3 ms line acquisition speed. Each transporter domain appears as a vertical line. c Projection (top) and height profile (bottom) of b. d HS-AFM image after HS-AFM-LS. The lateral position of recognizable features in a–d are indicated by arrowheads. e One second high-magnification views of dashed regions 1, 2, and 3 in b. Transport domain excursions to the inward-facing state appear as dark dwells along the vertical time axis. f Projection (top) and height profile (bottom) of e. Arrowheads indicate the position of the seven protomers in the kymograph (red: active protomer #5). g Height/time traces (gray) and state fits (red) of the active domain (protomer #5) in e. This figure is representative of the experimental sequence for the >50 replicates analyzed in this work.

*Tina R. Matin, George R. Heath, Gerard H. M. Huysmans, Olga Boudker and Simon Scheuring
Millisecond dynamics of an unlabeled amino acid transporter
Nature Communications volume 11, Article number: 5016 (2020)
DOI: https://doi.org/10.1038/s41467-020-18811-z

Please follow this external link to read the full article: https://rdcu.be/cbuOU

Open Access : The article “Millisecond dynamics of an unlabeled amino acid transporter” by Tina R. Matin, George R. Heath, Gerard H. M. Huysmans, Olga Boudker and Simon Scheuring is licensed under a Creative Commons Attribution 4.0 International License, which permits use, sharing, adaptation, distribution and reproduction in any medium or format, as long as you give appropriate credit to the original author(s) and the source, provide a link to the Creative Commons license, and indicate if changes were made. The images or other third party material in this article are included in the article’s Creative Commons license, unless indicated otherwise in a credit line to the material. If material is not included in the article’s Creative Commons license and your intended use is not permitted by statutory regulation or exceeds the permitted use, you will need to obtain permission directly from the copyright holder. To view a copy of this license, visit https://creativecommons.org/licenses/by/4.0/.