Glycosaminoglycan-based biohybrid hydrogels are highly promising materials for tissue engineering and regenerative medicine due to their ability to provide cell-instructive environments. In this article, Jana Sievers-Liebschner, Ron Dockhorn, Jens Friedrichs, Thomas Kurth, Peter Fratzl, Jens-Uwe Sommer, Carsten Werner, and Uwe Freudenberg investigate the nanoscale molecular network structure of these hydrogels using an integrated analytical approach.
The study combines transmission electron microscopy, X-ray scattering, computer simulations, and AFM-based nanoindentation to quantitatively characterize nanoscale polymer network connectivity and structural inhomogeneities. These parameters are essential for understanding hydrogel mechanics, growth factor delivery, and cell–material interactions relevant to regenerative therapies and organoid culture systems.
Atomic force microscopy (AFM)-based nanoindentation measurements were performed to determine the mechanical stiffness of the hydrogels in both PBS and ethanol environments. Measurements were conducted using a modified NanoWorld PNP-TR-TL-Au AFM probe equipped with a 10 μm silica bead for colloidal probe nanoindentation.
Nanoindentation experiments were carried out using a set point of 6 nN and an approach/retract velocity of 5 μm/s. At least 70 force–distance curves were recorded for each sample at different positions across the hydrogel surface. Young’s modulus values were extracted using the Hertz model, enabling quantitative evaluation of hydrogel nanomechanical properties.
This work demonstrates how AFM-based nanoindentation with a NanoWorld AFM probe contributes to the detailed characterization of biohybrid hydrogel networks and supports the development of engineered matrices for biomedical applications.
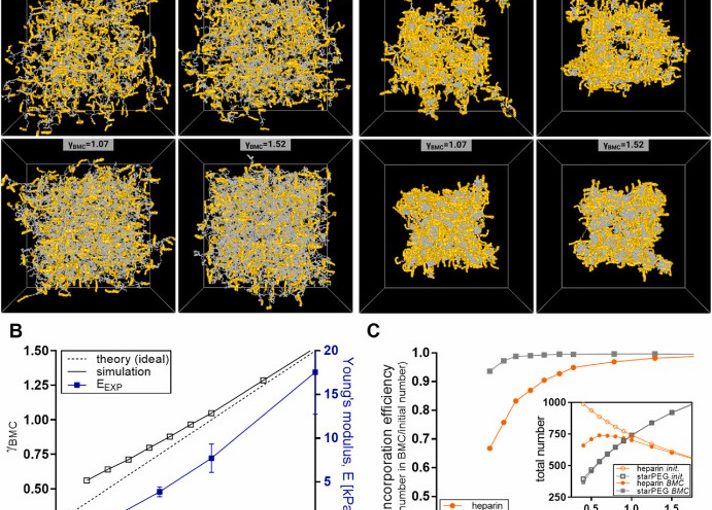
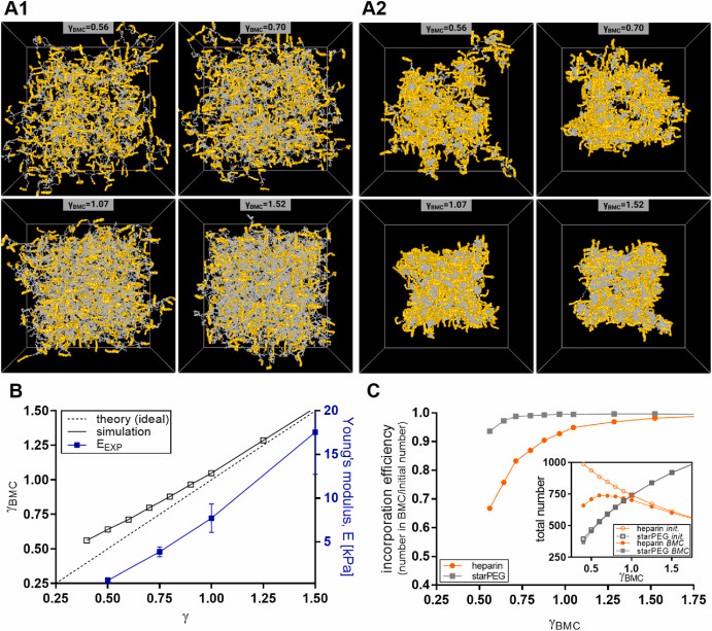
Fig. 5. Computational modelling of starPEG-heparin hydrogel networks. A: Simulation snapshots of hydrated and dehydrated starPEG-heparin hydrogels. For the hydrated network (A1), a good solvent (equivalent to PBS) was assumed. To model the dehydrated state (A2), parameters were adjusted to promote the self-aggregation of starPEG molecules in a poor solvent (e.g., ethanol). Networks with different effective molar ratios after crosslinking (γBMC, where BMC is the Biggest Molecule Cluster) are shown, assuming a 90 % extent of reaction between starPEG (grey) and heparin (yellow). Cube size: L = 150 nm. B: Molar ratio of the BMC γBMC after crosslinking at an extent of reaction p = 0.9, plotted as a function of the initial molar ratio. The dotted line represents the theoretical ideal value, while the blue line shows the experimentally determined Young’s moduli as a function of crosslinking degree. C: Incorporation efficiency of starPEG and heparin within the BMC, calculated as the number of starPEG or heparin molecules in the BMC divided by the number in the reaction mixture (ideal network). Insert: Total number of starPEG or heparin molecules in the reaction mixture (initial) or within the BMC. (For interpretation of the references to colour in this figure legend, the reader is referred to the Web version of this article.)
Full citation:
Sievers-Liebschner, J.; Dockhorn, R.; Friedrichs, J.; Kurth, T.; Fratzl, P.; Sommer, J.-U.; Werner, C.; Freudenberg, U. Unravelling the molecular network structure of biohybrid hydrogels.
Materials Today Bio 2025, 34, 102249. https://doi.org/10.1016/j.mtbio.2025.102249
The viscoelastic behavior of soft materials, especially cells and tissues, has been extensively investigated due to its importance in many biological and physiological processes that take place during development and even disease.*
Many techniques are used to quantify the mechanical properties of cells, among them micropipette aspiration, optical stretching, deformability cytometry and atomic force microscopy (AFM).*
The AFM, in particular, is still nowadays one of the most popular methods due to its conformity with various material types and geometries and the rather simple analysis process of the material properties.*
For a typical AFM indentation measurement, an AFM cantilever, with a distinct AFM tip shape, moves toward the sample with a predefined velocity and indents it until a prescribed force is reached. The AFM cantilever then moves upwards while detaching from the sample. The deflection and displacement signals of the AFM cantilever are processed further to extract the mechanical properties of the sample. Generally, a Hertzian model is fitted to the approach part of the force-indentation curves to quantify the apparent Young’s modulus.*
When applying the Hertzian model, few assumptions need to be considered, such as the material being homogeneous, isotropic, and linearly elastic. *
Cells and tissues, however, show not only elastic but also viscous behavior that is evident from the hysteresis between the approach and retraction segments of the force-indentation curve. Consequently, assessing this viscoelastic behavior is imperative for understanding the complex nature of biological matter.*
A number of studies utilized AFM to measure the viscoelastic properties of cells in both time and frequency domains.*
Ideally, to investigate the whole range of the viscoelastic behavior one needs to probe the material for a long time and observe its response or apply oscillatory signals and evaluate its phase lag. These approaches require the user to alter the probing method and add several steps to account for the time-dependent drift or the effect of the hydrodynamic drag of the surrounding medium. On top of that, in many of studies, the biological materials were probed with a linear approach followed by immediate retraction. The force-indentation curves from these studies were used to evaluate the apparent elastic modulus of the probed material using the standard Hertzian model. However, additional information concerning energy dissipation can still be extracted from the same curves to evaluate the viscoelasticity of the material.*
In the article “An explicit model to extract viscoelastic properties of cells from AFM force-indentation curves”, Shada Abuhattum, Dominic Mokbel, Paul Müller, Despina Soteriou, Jochen Guck and Sebastian Aland propose a new fitting model to extract the viscoelastic properties of soft materials from AFM force-indentation curves. *
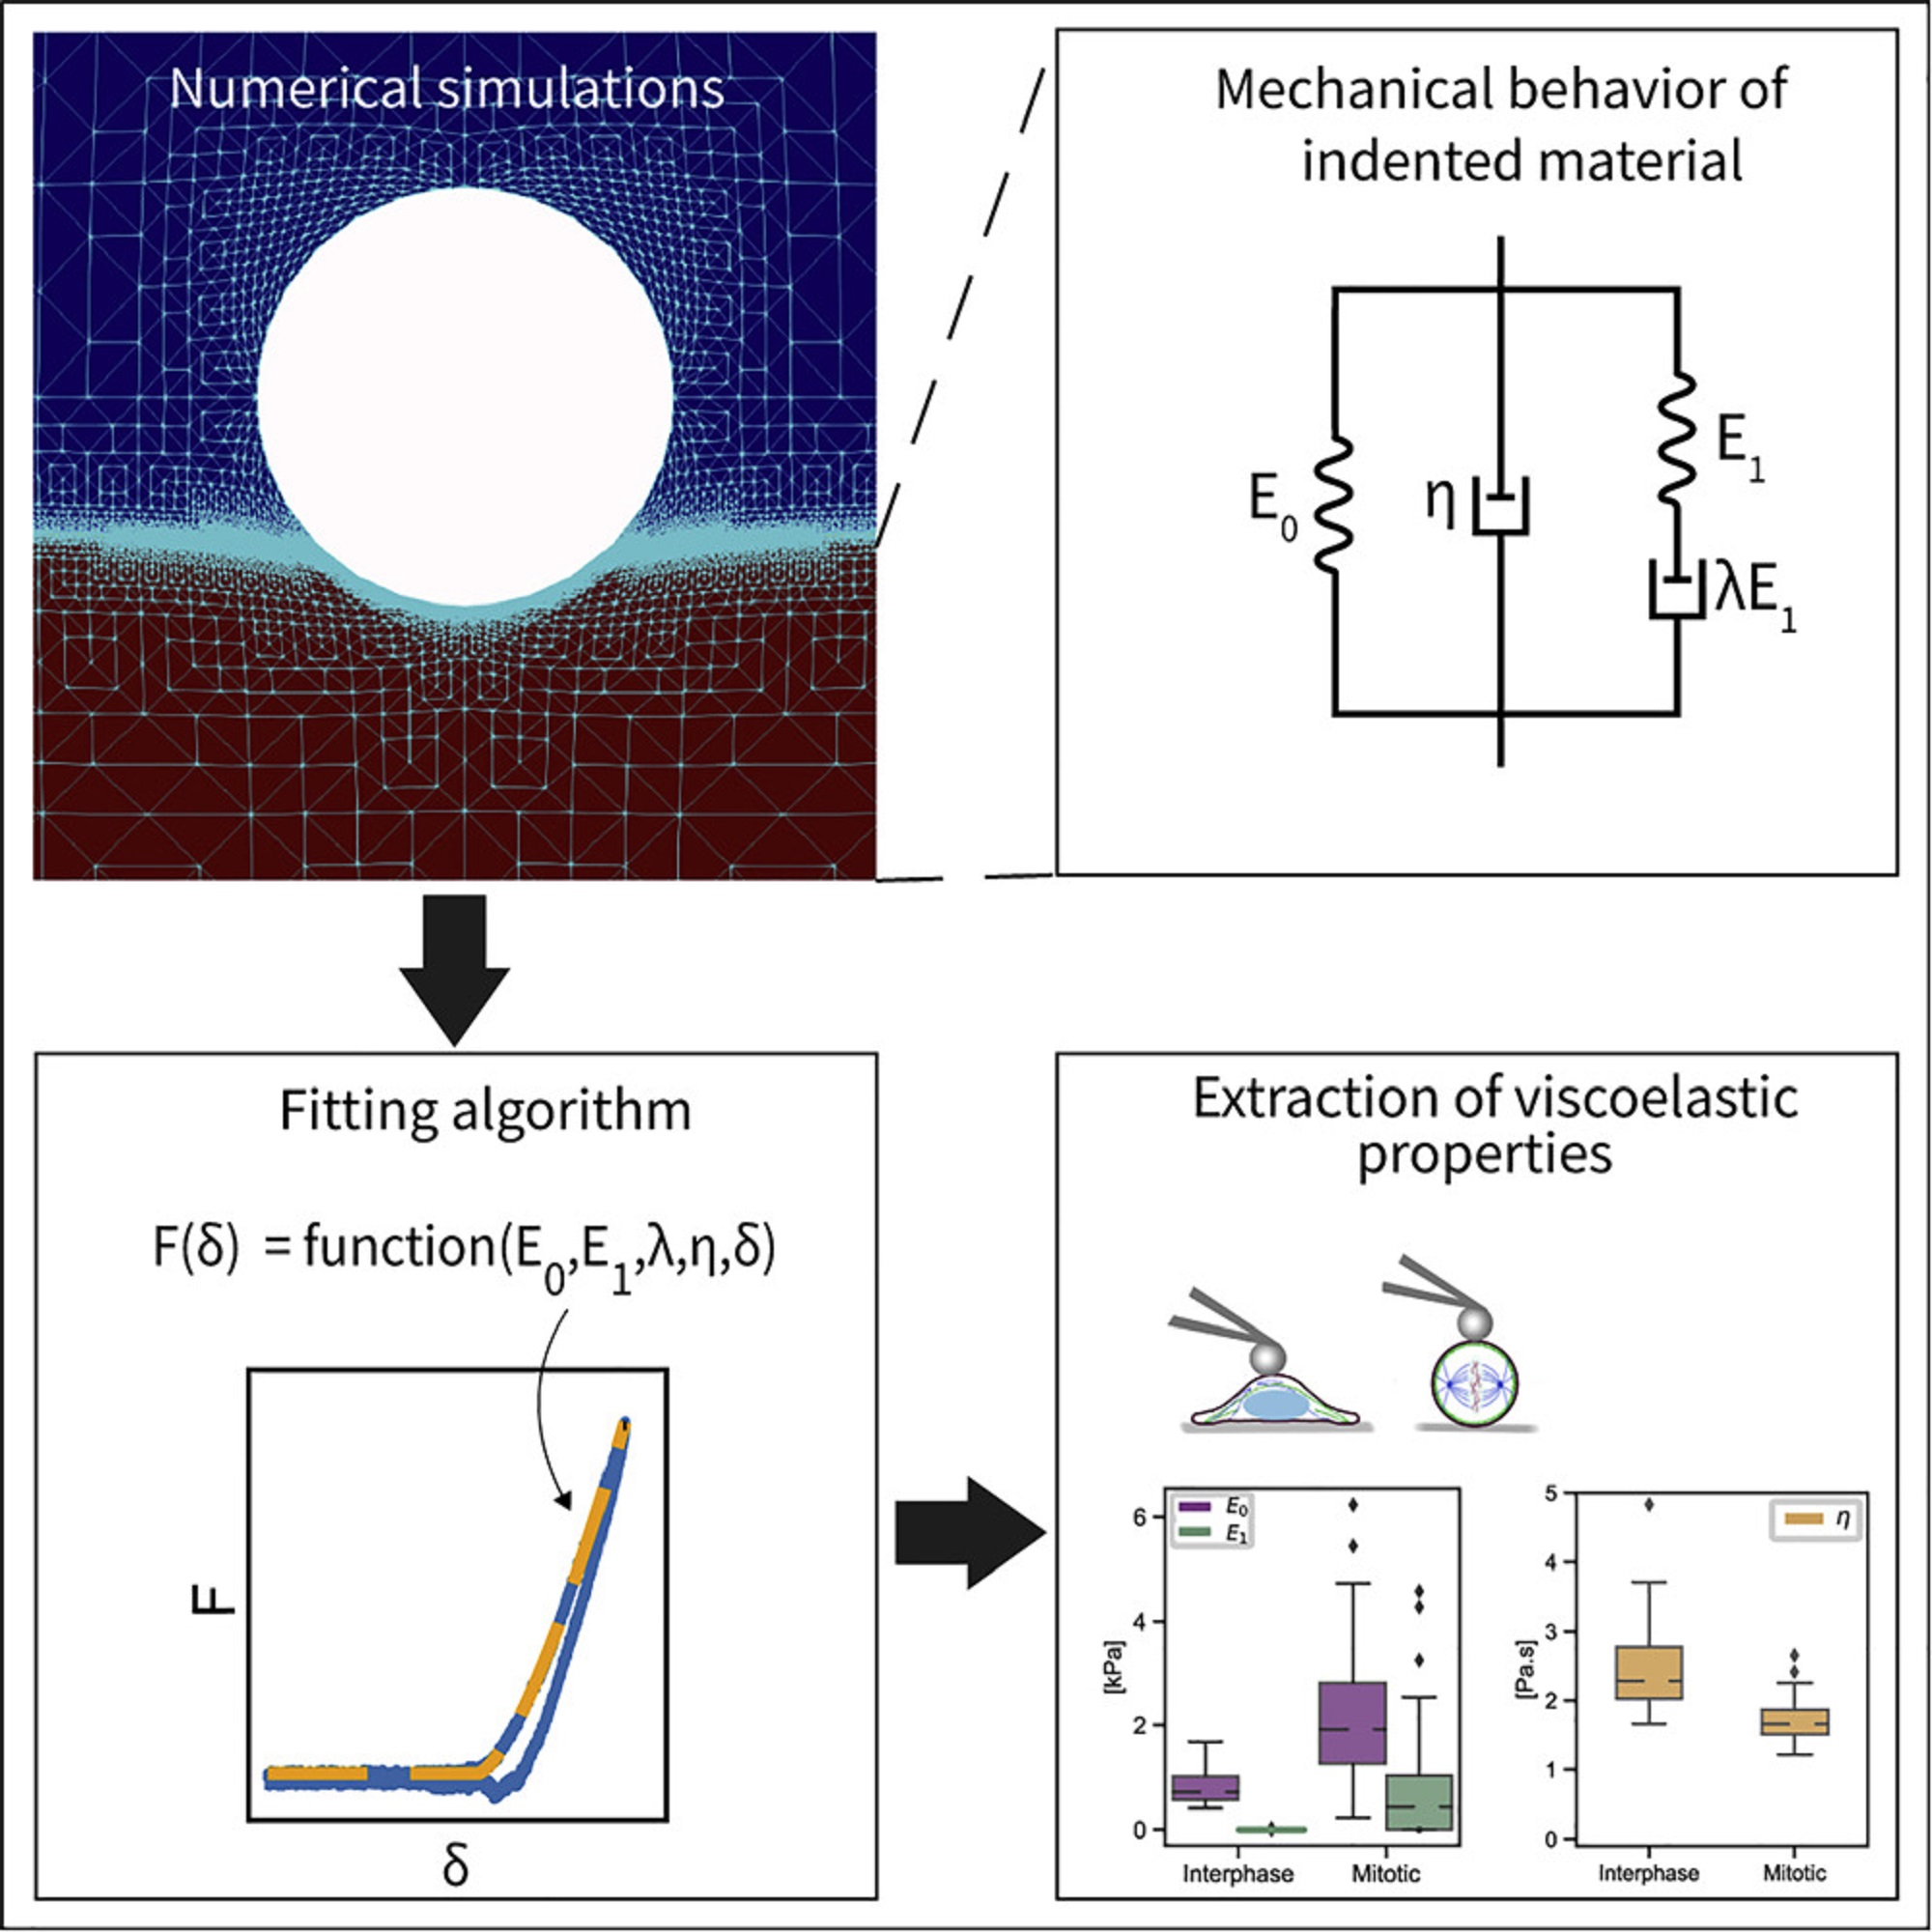
To construct the explicit relation of force and indentation, the authors first use a generalization of Maxwell and Kelvin-Voigt models to describe soft materials, and numerically simulate the indentation of such material with a spherical indenter. *
Shada Abuhattum et al. show that the proposed Kelvin-Voigt-Maxwell (KVM) model adequately captures the force-indentation curves of materials having different mechanical characteristics. *
Based on the simulation results, Shada Abuhattum et al. further propose an explicit force-indentation relation to be fitted to the force-indentation curves. This explicit relation simplifies the association of the mechanical properties with physically meaningful components and processes.
Finally, the authors apply the fitting model to a number of samples, including poroelastic and viscoelastic hydrogels as well as HeLa cells in two different cell cycle phases, interphase and mitotic. *
Shada Abuhattum et al. demonstrate that the distinct nature of the hydrogels, arising from the different crosslinking mechanisms, can be described with the fitting model. For the HeLa cells, the mitotic cells had a higher apparent elasticity and a lower apparent viscosity, implying a stiffer actin cortex and a diluted cytoplasm protein concentration, when compared with interphase cells.*
Their findings demonstrate that the proposed model can reliably extract viscoelastic properties from conventional force-indentation curves. Moreover, the model is able to assess the contribution of the different elastic and viscous elements, and thus allows a direct comparison between the viscoelastic nature of different materials.*
AFM measurements were preformed using a commercially available Atomic Force Microscope. To indent the samples, NanoWorld Pyrex-Nitride tipless AFM cantilevers PNP-TR-TL with a nominal spring constant of 0.08 mN/m were modified by gluing 5 μm diameter polystyrene beads to the underside of the AFM cantilevers using two component glue.*
The AFM cantilevers were calibrated prior to each experiment using the thermal noise method and their accurate spring constant ranged between 0.047-0.059 mN/m. For PAAm and agarose hydrogels, the AFM cantilever was lowered with a constant velocity (5, 10, or 15 μm/s) toward the surface of the sample until a force of 2 nN for agarose and 4 nN for PAAm was reached. These force set points accounted for an indentation in the range of 0.5–1 μm. For HeLa cells, the AFM cantilever was lowered with a constant velocity of 2 μm/s and the cells were indented until a force of 2 nN was reached, which accounted for an indentation depth in the range of 0.5–1.5 μm.*
Graphical abstract for the article “An explicit model to extract viscoelastic properties of cells from AFM force-indentation curves” by Shada Abuhattum at al. 2022. NanoWorld Pyrex-Nitride tipless AFM cantilevers PNP-TR-TL with a nominal spring constant of 0.08 mN/m were modified by gluing 5 μm diameter polystyrene beads to the underside of the AFM cantilevers using two component glue were used for the atomic force microscopy indentation measurements described in the cited article.
*Shada Abuhattum, Dominic Mokbel, Paul Müller, Despina Soteriou, Jochen Guck and Sebastian Aland An explicit model to extract viscoelastic properties of cells from AFM force-indentation curves
iScience, Volume 25, ISSUE 4, 104016, April 15, 2022
DOI: https://doi.org/10.1016/j.isci.2022.104016
The article “An explicit model to extract viscoelastic properties of cells from AFM force-indentation curves” by Shada Abuhattum, Dominic Mokbel, Paul Müller, Despina Soteriou, Jochen Guck and Sebastian Aland is licensed under a Creative Commons Attribution 4.0 International License, which permits use, sharing, adaptation, distribution and reproduction in any medium or format, as long as you give appropriate credit to the original author(s) and the source, provide a link to the Creative Commons license, and indicate if changes were made. The images or other third-party material in this article are included in the article’s Creative Commons license, unless indicated otherwise in a credit line to the material. If material is not included in the article’s Creative Commons license and your intended use is not permitted by statutory regulation or exceeds the permitted use, you will need to obtain permission directly from the copyright holder. To view a copy of this license, visit https://creativecommons.org/licenses/by/4.0/.
Airflow limitation in obstructive airway disease is characterized by narrowing of the airway lumen from excessive contraction of airway smooth muscle (ASM) and remodeling of the airway wall which includes changes in the extracellular matrix (ECM) of the ASM layer.*
Previous studies on human airway smooth muscle cells ( hASMC ) have independently assessed the influence of extracellular matrix (ECM) proteins on substrates of supra-physiological stiffnesses, such as tissue culture plastic or glass.*
While the influence of discrete substrate stiffness on hASMC behavior has been examined, manipulation of both substrate stiffness and ECM proteins simultaneously (as expected in disease) has not been extensively modeled in vitro.*
In the article “Stiffness Mediated-Mechanosensation of Airway Smooth Muscle Cells on Linear Stiffness Gradient Hydrogels” Yong Hwee Tan, Kimberley C. W. Wang, Ian L. Chin, Rowan W. Sanderson, Jiayue Li, Brendan F. Kennedy, Peter B. Noble and Yu Suk Choi highlight the interplay and complexities between stiffness and ECM protein type on hASMC mechanosensation, relevant to airway remodelling in obstructive airway diseases.*
The authors first determined a physiological range of ASM layer stiffness using a porcine airway and used these empirical recordings to inform the fabrication of a linear stiffness gradient platform coated with different ECM proteins.*
Using this linear stiffness gradient platform, Yong Hwee Tan et al. profiled hASMC morphology, contractile function with alpha-smooth muscle actin (αSMA) and mechanisms of mechanosensation, specifically with nuclear translocalization of Yes-associated protein (YAP) and lamin-A expression.*
Yong Hwee Tan et al.’s assessment of hASMC mechanosensation utilized an innovative hydrogel platform delivering a linear stiffness gradient to understand stiffness-mediated cell behavior with an ECM substrate for cellular adhesion. *
The employment of a stiffness gradient that was designed after empirical measurements performed on ex vivo ASM tissue, enabled the presentation of physiologically relevant stiffnesses to study hASMC behavior.*
Using this platform, the authors of the article found that hASMC mechanosense underlying mechanical cues more than the types of proteins they are anchored to by screening hASMC morphology, contractile phenotype, and mechanomarker expression, with a few exceptions.*
While the authors acknowledge that the findings from their study were done using cells from only one donor they still think that their study provides a proof of concept for the relevance of hASMC mechanosensation to ECM stiffness, and is another step in the right direction for understanding the pathophysiological impact of airway remodeling in obstructive diseases and exploring potential avenues for improving therapy through greater fidelity of in vitro platforms that include key concepts of mechanosensation. *
Yong Hwee Tan et al. wanted to use the same method which is used to assess hydrogel stiffness, namely atomic force microscopy (AFM), to measure ASM stiffness.*
However, nanoscale measurements of ASM strips by AFM proved to be difficult due to an uneven tissue surface after de-epithelialization (Figure S1C, Supporting Information of the cited article), resulting in false force triggering.
To validate the translation of stiffness values measured from macroscale compression (ASM strips) to nanoscale indentation (AFM on hydrogels), Yong Hwee Tan et al. fabricated additional hydrogels of four different stiffnesses using well-characterized polyacrylamide and compared the stiffness of hydrogels measured by uniaxial compression tester and atomic force microscopy (Figure S2A, Supporting Information of the cited article).
The nanoscale stiffness of hydrogels was assessed using an atomic force microscope (AFM) with NanoWorld triangular Pyrex-NitridePNP-TR AFM probes (the longer AFM cantilever beam – CB 2 – with 200 µm length was used).
These AFM tips probed hydrogels immersed in 1 × PBS with 2 nN, an approach velocity of 2 µm s−1 and a retraction velocity of 10 µm s−1.
Young’s modulus was determined from linear portions of contact-generated force curves using a custom-written code in Igor Pro.
All probe indentations were made in triplicate and averaged for a stiffness measurement in kilopascals (kPa).
An example force curve is shown in Figure S2B, Supporting Information of the cited article. Validation of a linear stiffness gradient was achieved with eight indentations on the hydrogel, 2 mm away from both edges of the hydrogel and at 1 mm intervals along the stiffness gradient axis. Measurements were plotted against displacement from the hydrogel edge (soft to stiff) (Figure 2B of the cited article).
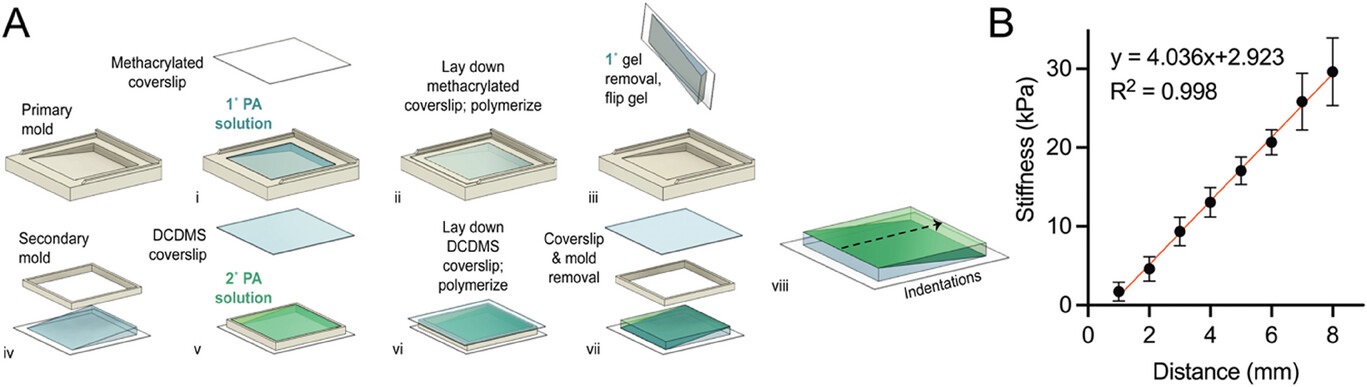
Figure 2 from Yong Hwee Tan et al. 2024 “Stiffness Mediated-Mechanosensation of Airway Smooth Muscle Cells on Linear Stiffness Gradient Hydrogels”: Linear stiffness gradient hydrogel fabrication. A) A schematic of a two-step polymerization process. i) 120 µL of mixed polyacrylamide (PA) solution (% acrylamide + % bis-acrylamide) was added to the primary mold and left to polymerize under ii) a methacrylated coverslip for 20 min. iii) Wedge-shaped 1° gel was removed and flipped for placement of a iv) secondary mold before v) addition of a second 120 µL PA solution and polymerized under a vi) dichlorodimethylsilane-coated coverslip for 20 min. vii) Removal of coverslip and mold completes the fabrication of bi-layered stiffness gradient hydrogel. viii) the dotted arrow indicating the direction of gradient and atomic force microscopy (AFM) measurement. B) Young’s moduli gradient measured by AFM. Twelve hydrogels were selected (one gel per batch) and assessed for stiffness, yielding a gradient of 4.0 kPa mm−1, with a range of 1.7 ± 1.2 to 29.6 ± 4.3 kPa (R2 = 0.998, n = 8). Data are presented as mean ± SD.
Figure S2 from Yong Hwee Tan et al. 2024 “Stiffness Mediated-Mechanosensation of Airway Smooth Muscle Cells on Linear Stiffness Gradient Hydrogels”: (A) Correlation of Young’s modulus from macroscale stiffness (UCT) assessment with nanoindentation (AFM), was conducted using cylindrical PA hydrogels of different Acrylamide %/Bis-acrylamide % derived from Tse and Engler [47] 10 %/0.06 %, 10 %/0.1 %, 10 %/0.15 % and 10 %/0.3 % (Linear regression, P < 0.0001, R2 = 0.9288, n = 4). Data are presented as mean SEM. (B) An example force curve from atomic force microscopy with an approach velocity of 2 μm/s, until a 2 nN trigger force was registered, and retraction of indenter at 10 μm/s.*Yong Hwee Tan, Kimberley C. W. Wang, Ian L. Chin, Rowan W. Sanderson, Jiayue Li, Brendan F. Kennedy, Peter B. Noble and Yu Suk Choi Stiffness Mediated-Mechanosensation of Airway Smooth Muscle Cells on Linear Stiffness Gradient Hydrogels
Advanced Healthcare Materials 2024, 2304254
DOI: https://doi.org/10.1002/adhm.202304254
The article “Stiffness Mediated-Mechanosensation of Airway Smooth Muscle Cells on Linear Stiffness Gradient Hydrogels” by Yong Hwee Tan, Kimberley C. W. Wang, Ian L. Chin, Rowan W. Sanderson, Jiayue Li, Brendan F. Kennedy, Peter B. Noble and Yu Suk Choi is licensed under a Creative Commons Attribution 4.0 International License, which permits use, sharing, adaptation, distribution and reproduction in any medium or format, as long as you give appropriate credit to the original author(s) and the source, provide a link to the Creative Commons license, and indicate if changes were made. The images or other third-party material in this article are included in the article’s Creative Commons license, unless indicated otherwise in a credit line to the material. If material is not included in the article’s Creative Commons license and your intended use is not permitted by statutory regulation or exceeds the permitted use, you will need to obtain permission directly from the copyright holder. To view a copy of this license, visit https://creativecommons.org/licenses/by/4.0/.
![Figure S2 from Yong Hwee Tan et al. 2024 “Stiffness Mediated-Mechanosensation of Airway Smooth Muscle Cells on Linear Stiffness Gradient Hydrogels”:(A) Correlation of Young’s modulus from macroscale stiffness (UCT) assessment with nanoindentation (AFM), was conducted using cylindrical PA hydrogels of different Acrylamide %/Bis-acrylamide % derived from Tse and Engler [47] 10 %/0.06 %, 10 %/0.1 %, 10 %/0.15 % and 10 %/0.3 % (Linear regression, P < 0.0001, R2 = 0.9288, n = 4). Data are presented as mean SEM. (B) An example force curve from atomic force microscopy with an approach velocity of 2 μm/s, until a 2 nN trigger force was registered, and retraction of indenter at 10 μm/s. NanoWorld triangular Pyrex-Nitride PNP-TR AFM probes were used to assess the stiffness of the hydrogels with atomic force microscopy.](https://www.nanoworld.com/blog/wp-content/uploads/2024/07/Fig-S2-from-Young-Hwee-Tan-2024-Stiffness-Mediated-Mechanosensation-of-Airway-Smooth-Muscle-Cells-on-Linear-Stiffness-Gradient-Hydrogels-NanoWorld-PNP-TR-AFM-probe.jpg)