Happy Birthday Switzerland – Swiss National Holiday 2024
Airflow limitation in obstructive airway disease is characterized by narrowing of the airway lumen from excessive contraction of airway smooth muscle (ASM) and remodeling of the airway wall which includes changes in the extracellular matrix (ECM) of the ASM layer.*
Previous studies on human airway smooth muscle cells ( hASMC ) have independently assessed the influence of extracellular matrix (ECM) proteins on substrates of supra-physiological stiffnesses, such as tissue culture plastic or glass.*
While the influence of discrete substrate stiffness on hASMC behavior has been examined, manipulation of both substrate stiffness and ECM proteins simultaneously (as expected in disease) has not been extensively modeled in vitro.*
In the article “Stiffness Mediated-Mechanosensation of Airway Smooth Muscle Cells on Linear Stiffness Gradient Hydrogels” Yong Hwee Tan, Kimberley C. W. Wang, Ian L. Chin, Rowan W. Sanderson, Jiayue Li, Brendan F. Kennedy, Peter B. Noble and Yu Suk Choi highlight the interplay and complexities between stiffness and ECM protein type on hASMC mechanosensation, relevant to airway remodelling in obstructive airway diseases.*
The authors first determined a physiological range of ASM layer stiffness using a porcine airway and used these empirical recordings to inform the fabrication of a linear stiffness gradient platform coated with different ECM proteins.*
Using this linear stiffness gradient platform, Yong Hwee Tan et al. profiled hASMC morphology, contractile function with alpha-smooth muscle actin (αSMA) and mechanisms of mechanosensation, specifically with nuclear translocalization of Yes-associated protein (YAP) and lamin-A expression.*
Yong Hwee Tan et al.’s assessment of hASMC mechanosensation utilized an innovative hydrogel platform delivering a linear stiffness gradient to understand stiffness-mediated cell behavior with an ECM substrate for cellular adhesion. *
The employment of a stiffness gradient that was designed after empirical measurements performed on ex vivo ASM tissue, enabled the presentation of physiologically relevant stiffnesses to study hASMC behavior.*
Using this platform, the authors of the article found that hASMC mechanosense underlying mechanical cues more than the types of proteins they are anchored to by screening hASMC morphology, contractile phenotype, and mechanomarker expression, with a few exceptions.*
While the authors acknowledge that the findings from their study were done using cells from only one donor they still think that their study provides a proof of concept for the relevance of hASMC mechanosensation to ECM stiffness, and is another step in the right direction for understanding the pathophysiological impact of airway remodeling in obstructive diseases and exploring potential avenues for improving therapy through greater fidelity of in vitro platforms that include key concepts of mechanosensation. *
Yong Hwee Tan et al. wanted to use the same method which is used to assess hydrogel stiffness, namely atomic force microscopy (AFM), to measure ASM stiffness.*
However, nanoscale measurements of ASM strips by AFM proved to be difficult due to an uneven tissue surface after de-epithelialization (Figure S1C, Supporting Information of the cited article), resulting in false force triggering.
To validate the translation of stiffness values measured from macroscale compression (ASM strips) to nanoscale indentation (AFM on hydrogels), Yong Hwee Tan et al. fabricated additional hydrogels of four different stiffnesses using well-characterized polyacrylamide and compared the stiffness of hydrogels measured by uniaxial compression tester and atomic force microscopy (Figure S2A, Supporting Information of the cited article).
The nanoscale stiffness of hydrogels was assessed using an atomic force microscope (AFM) with NanoWorld triangular Pyrex-Nitride PNP-TR AFM probes (the longer AFM cantilever beam – CB 2 – with 200 µm length was used).
These AFM tips probed hydrogels immersed in 1 × PBS with 2 nN, an approach velocity of 2 µm s−1 and a retraction velocity of 10 µm s−1.
Young’s modulus was determined from linear portions of contact-generated force curves using a custom-written code in Igor Pro.
All probe indentations were made in triplicate and averaged for a stiffness measurement in kilopascals (kPa).
An example force curve is shown in Figure S2B, Supporting Information of the cited article. Validation of a linear stiffness gradient was achieved with eight indentations on the hydrogel, 2 mm away from both edges of the hydrogel and at 1 mm intervals along the stiffness gradient axis. Measurements were plotted against displacement from the hydrogel edge (soft to stiff) (Figure 2B of the cited article).
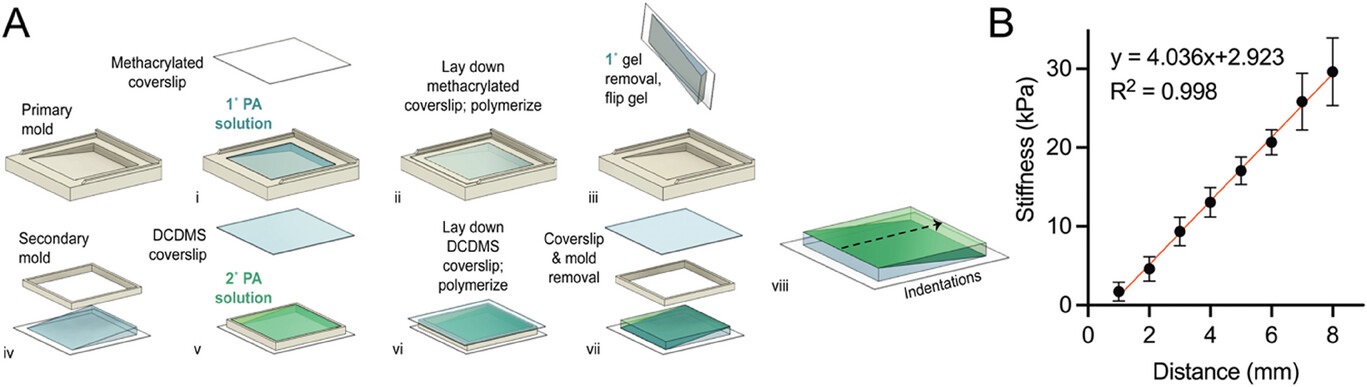
![Figure S2 from Yong Hwee Tan et al. 2024 “Stiffness Mediated-Mechanosensation of Airway Smooth Muscle Cells on Linear Stiffness Gradient Hydrogels”:(A) Correlation of Young’s modulus from macroscale stiffness (UCT) assessment with nanoindentation (AFM), was conducted using cylindrical PA hydrogels of different Acrylamide %/Bis-acrylamide % derived from Tse and Engler [47] 10 %/0.06 %, 10 %/0.1 %, 10 %/0.15 % and 10 %/0.3 % (Linear regression, P < 0.0001, R2 = 0.9288, n = 4). Data are presented as mean SEM. (B) An example force curve from atomic force microscopy with an approach velocity of 2 μm/s, until a 2 nN trigger force was registered, and retraction of indenter at 10 μm/s. NanoWorld triangular Pyrex-Nitride PNP-TR AFM probes were used to assess the stiffness of the hydrogels with atomic force microscopy.](https://www.nanoworld.com/blog/wp-content/uploads/2024/07/Fig-S2-from-Young-Hwee-Tan-2024-Stiffness-Mediated-Mechanosensation-of-Airway-Smooth-Muscle-Cells-on-Linear-Stiffness-Gradient-Hydrogels-NanoWorld-PNP-TR-AFM-probe.jpg)
(A) Correlation of Young’s modulus from macroscale stiffness (UCT) assessment with nanoindentation (AFM), was conducted using cylindrical PA hydrogels of different Acrylamide %/Bis-acrylamide % derived from Tse and Engler [47] 10 %/0.06 %, 10 %/0.1 %, 10 %/0.15 % and 10 %/0.3 % (Linear regression, P < 0.0001, R2 = 0.9288, n = 4). Data are presented as mean SEM. (B) An example force curve from atomic force microscopy with an approach velocity of 2 μm/s, until a 2 nN trigger force was registered, and retraction of indenter at 10 μm/s.
Stiffness Mediated-Mechanosensation of Airway Smooth Muscle Cells on Linear Stiffness Gradient Hydrogels
Advanced Healthcare Materials 2024, 2304254
DOI: https://doi.org/10.1002/adhm.202304254
The article “Stiffness Mediated-Mechanosensation of Airway Smooth Muscle Cells on Linear Stiffness Gradient Hydrogels” by Yong Hwee Tan, Kimberley C. W. Wang, Ian L. Chin, Rowan W. Sanderson, Jiayue Li, Brendan F. Kennedy, Peter B. Noble and Yu Suk Choi is licensed under a Creative Commons Attribution 4.0 International License, which permits use, sharing, adaptation, distribution and reproduction in any medium or format, as long as you give appropriate credit to the original author(s) and the source, provide a link to the Creative Commons license, and indicate if changes were made. The images or other third-party material in this article are included in the article’s Creative Commons license, unless indicated otherwise in a credit line to the material. If material is not included in the article’s Creative Commons license and your intended use is not permitted by statutory regulation or exceeds the permitted use, you will need to obtain permission directly from the copyright holder. To view a copy of this license, visit https://creativecommons.org/licenses/by/4.0/.
NanoWorld AG CEO Manfred Detterbeck is attending NANOKOREA 2024, the 22nd International #Nanotech Symposium & Exhibition on nanoscale science and technology , which will be held from July 3-5, 2024 at KINTEX (Korea International Exhibition Center), Goyang-si, Gyeonggi-do, South Korea. http://www.nanokorea-sympo.or.kr/welcome.php
This year’s main theme is: Invisible Nano Realizes the Future
Will we meet you there too?