Representing a central element of the innate immune system, neutrophils are recruited from the blood stream to a site of inflammation. The recruitment process follows a well-defined sequence of events including adhesion to the blood vessel walls, migration, and chemotaxis to reach the inflammatory focus. A common feature of the underlying signalling pathways is the utilization of Ca2+ ions as intracellular second messengers. However, the required Ca2+ influx channels are not yet fully characterized.*
In the article “Intravascular adhesion and recruitment of neutrophils in response to CXCL1 depends on their TRPC6 channels” Otto Lindemann, Jan Rossaint, Karolina Najder, Sandra Schimmelpfennig, Verena Hofschröer, Mike Wälte, Benedikt Fels, Hans Oberleithner, Alexander Zarbock and Albrecht Schwab report a novel role for TRPC6, a member of the transient receptor potential (TRPC) channel family, in the CXCL1-dependent recruitment of murine neutrophil granulocytes.*
The authors describe how they tested whether TRPC6 channels are central elements of the signalling cascade underlying CXCR2-mediated neutrophil recruitment. They combined intravital microscopy, single-cell force spectroscopy with atomic force microscopy, Ca2+ imaging, and microfluidic flow chamber assays to investigate the role of TRPC6 channels in murine neutrophils for their recruitment in renal ischemia-reperfusion and cremaster models as well as in in vitro assays.*
The study reveals that TRPC6 channels in neutrophils are crucial signalling modules in their recruitment from the blood stream in response to CXCL1.*
The single-cell force spectroscopy experiments were performed by using atomic force microscopy (AFM) with NanoWorld Arrow-TL1 tipless cantilevers which were incubated prior to experiments for 30 min in Cell-Tak to make the AFM cantilever sticky for neutrophils.*

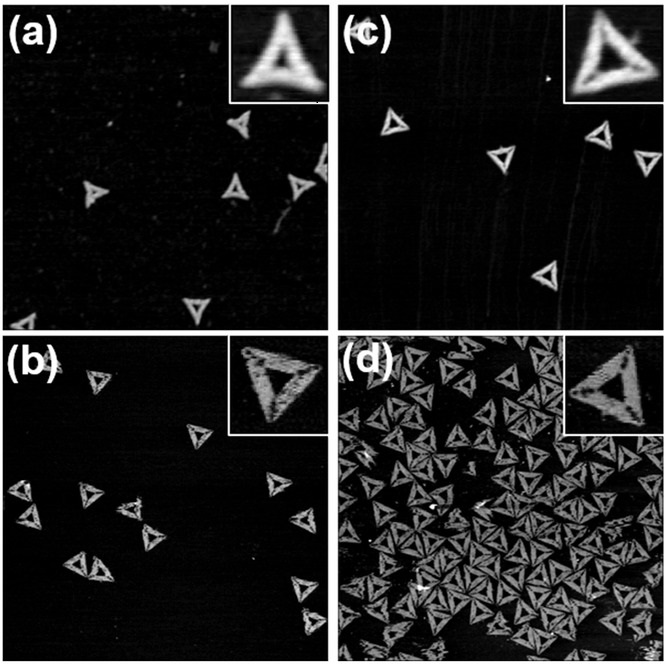
Figure 4a from “Intravascular adhesion and recruitment of neutrophils in response to CXCL1 depends on their TRPC6 channels” by Otto Lindemann et al:
Force-distance curves were obtained by probing bEnd5 cells with the neutrophil-carrying cantilever using 1 nN maximal loading force

Tipless cantilever,
single cantilever beam on a silicon support chip
*Otto Lindemann, Jan Rossaint, Karolina Najder, Sandra Schimmelpfennig, Verena Hofschröer, Mike Wälte, Benedikt Fels, Hans Oberleithner, Alexander Zarbock and Albrecht Schwab
Intravascular adhesion and recruitment of neutrophils in response to CXCL1 depends on their TRPC6 channels
Journal of Molecular Medicine volume 98, pages349–360(2020)
DOI: https://doi.org/10.1007/s00109-020-01872-4
Please follow this external link to read the full article: https://link.springer.com/article/10.1007/s00109-020-01872-4
Open Access The article “ Intravascular adhesion and recruitment of neutrophils in response to CXCL1 depends on their TRPC6 channels “ by Otto Lindemann, Jan Rossaint, Karolina Najder, Sandra Schimmelpfennig, Verena Hofschröer, Mike Wälte, Benedikt Fels, Hans Oberleithner, Alexander Zarbock and Albrecht Schwab is licensed under a Creative Commons Attribution 4.0 International License, which permits use, sharing, adaptation, distribution and reproduction in any medium or format, as long as you give appropriate credit to the original author(s) and the source, provide a link to the Creative Commons license, and indicate if changes were made. The images or other third party material in this article are included in the article’s Creative Commons license, unless indicated otherwise in a credit line to the material. If material is not included in the article’s Creative Commons license and your intended use is not permitted by statutory regulation or exceeds the permitted use, you will need to obtain permission directly from the copyright holder. To view a copy of this license, visit http://creativecommons.org/licenses/by/4.0/.