NanoWorld CEO Manfred Detterbeck is in Boston for the MRS Fall 2024 Meeting & Exhibit this week.
You’ll meet him at some of the sessions or at NanoAndMore USA booth no. 402.
If you’re there too feel free to say hi and have a chat about #AFMprobes with him.
Happy to be at MRS Fall 2024. Hope to see many of you here.
Kaolinite is one of the most abundant natural clay minerals within soils at the Earth’s surface and within rock units in the upper crust. *
The interface between aqueous solutions and the facets of kaolinite plays an important role in a wide range of technological applications including tribology, paper production, oil recovery, waste water treatment and medical devices. *
This is made possible by kaolinite’s layered structure, with its two basal surfaces -aluminol and siloxane-exhibiting different properties and reactivity. *
Both macroscopic and nanoscale studies point to a strong dependence of kaolinite’s surface properties on its local hydration structure. No experimental results, however, have systematically and comparatively investigated the hydration landscape of both basal facets to date. *
In the article “Local probing of the nanoscale hydration landscape of kaolinite basal facets in the presence of ions” Clodomiro Cafolla, Tai Bui, Tran Thi Bao Le, Andrea Zen, Weparn J. Tay, Alberto Striolo, Angelos Michaelides, Hugh Christopher Greenwell and Kislon Voïtchovsky combine high-resolution atomic force microscopy (AFM) imaging and force spectroscopy with classical molecular dynamics (MD) simulations to illustrate key differences in the hydration behaviour of the aluminol and siloxane facets of kaolinite particles immersed in water and NaCl solutions. *
This combined approach allows the authors to overcome the limitations of each technique via the advantages of the other. Specifically, AFM images highlight the differences in the first hydration layer of each facet and serve as a basis for force spectroscopy measurements of the full hydration profile at a given location. *
Water densities extracted from MD help interpret the AFM results, both in the absence and in the presence of added Na+ ions. *
Complementary AFM spectroscopy measurements show an excellent agreement between the conservative component and MD’s water density profiles, with discrete hydration layers on both facets and little sensitivity to added ions. *
The dissipative component of the measured AFM tip-sample interactions is more sensitive to the presence of ions, with MD suggesting a link with the local water dynamics and transient instabilities between stable hydration layers. *
These effects are facet-dependant and more pronounced on the aluminol facet where the first water layer is better defined. Increasing the salt concentration allows hydrated ions to form more stable layers, with hints of organised ionic domains. *
The results provide unique insights into both the equilibrium molecular structure and dynamics of the kaolinite facets, potentially informing applications involving interfacial processes. *
The AFM experiments were conducted at 25 ± 0.1 °C using a commercial atomic force microscope equipped with temperature control.
NanoWorld Arrow-UHF silicon AFM probes were used.
The AFM cantilevers were thoroughly washed with pure water (20 times with 100 μl) and then with the solution of interest (40 times with 100 μl).
Experiments were performed at near neutral pH 5.8. This ensured that only the metal ions of interest were present on the AFM cantilever. Thorough cleaning procedures were implemented to avoid any possible sources of contamination. *
During the measurements, the AFM cantilever and the sample were fully immersed in the aqueous ionic solution of interest. The thermal spectrum of the AFM cantilever was used to perform the flexural calibration of the AFM cantilevers. The AFM probes were found to have a flexural spring constant in the range 1.0–4.0 N/m and a resonance frequency of ∼400–900 kHz in water. These values agree with the nominal range and the literature. The AFM cantilever oscillation was photo-thermally driven to ensure greater stability, making sure that the frequency response remained unaffected by any spurious contributions due to the noise produced by mechanical coupling with other experimental components of the system. *
Fig. 2 from Clodomiro Cafolla et al. 2024 “Local probing of the nanoscale hydration landscape of kaolinite basal facets in the presence of ions”: Representative experimental (AFM) and computational (MD) images of both kaolinite facets. For each image, the corresponding atomic arrangement of the facet is superimposed to scale. The green triangle highlights the brightest periodic features appearing in both AFM and MD, showing a good agreement. The MD images represent the density distribution of the first hydration layer over each facet. The insets show the Fast Fourier Transform (FFT) of each image and highlight the first (red), second (orange) and third (cyan) order intensity peaks. The MD results represent a 2D projection for the water oxygen density in the first hydration layer averaged over 3 ns. The scale bar represents 1 nm. The AFM colour scale bar represents a height variation of ∼0.3 nm; the MD colour scale is based on a density range at a fixed height (first hydration layer). (For interpretation of the references to colour in this figure legend, the reader is referred to the Web version of this article.)
*Clodomiro Cafolla, Tai Bui, Tran Thi Bao Le, Andrea Zen, Weparn J. Tay, Alberto Striolo, Angelos Michaelides, Hugh Christopher Greenwell and Kislon Voïtchovsky Local probing of the nanoscale hydration landscape of kaolinite basal facets in the presence of ions
Materials Today Physics, Volume 46, August 2024, 101504
DOI: https://doi.org/10.1016/j.mtphys.2024.101504
Open Access The article “Local probing of the nanoscale hydration landscape of kaolinite basal facets in the presence of ions” by Clodomiro Cafolla, Tai Bui, Tran Thi Bao Le, Andrea Zen, Weparn J. Tay, Alberto Striolo, Angelos Michaelides, Hugh Christopher Greenwell and Kislon Voïtchovsky is licensed under a Creative Commons Attribution 4.0 International License, which permits use, sharing, adaptation, distribution and reproduction in any medium or format, as long as you give appropriate credit to the original author(s) and the source, provide a link to the Creative Commons license, and indicate if changes were made. The images or other third party material in this article are included in the article’s Creative Commons license, unless indicated otherwise in a credit line to the material. If material is not included in the article’s Creative Commons license and your intended use is not permitted by statutory regulation or exceeds the permitted use, you will need to obtain permission directly from the copyright holder. To view a copy of this license, visit http://creativecommons.org/licenses/by/4.0/.
Airflow limitation in obstructive airway disease is characterized by narrowing of the airway lumen from excessive contraction of airway smooth muscle (ASM) and remodeling of the airway wall which includes changes in the extracellular matrix (ECM) of the ASM layer.*
Previous studies on human airway smooth muscle cells ( hASMC ) have independently assessed the influence of extracellular matrix (ECM) proteins on substrates of supra-physiological stiffnesses, such as tissue culture plastic or glass.*
While the influence of discrete substrate stiffness on hASMC behavior has been examined, manipulation of both substrate stiffness and ECM proteins simultaneously (as expected in disease) has not been extensively modeled in vitro.*
In the article “Stiffness Mediated-Mechanosensation of Airway Smooth Muscle Cells on Linear Stiffness Gradient Hydrogels” Yong Hwee Tan, Kimberley C. W. Wang, Ian L. Chin, Rowan W. Sanderson, Jiayue Li, Brendan F. Kennedy, Peter B. Noble and Yu Suk Choi highlight the interplay and complexities between stiffness and ECM protein type on hASMC mechanosensation, relevant to airway remodelling in obstructive airway diseases.*
The authors first determined a physiological range of ASM layer stiffness using a porcine airway and used these empirical recordings to inform the fabrication of a linear stiffness gradient platform coated with different ECM proteins.*
Using this linear stiffness gradient platform, Yong Hwee Tan et al. profiled hASMC morphology, contractile function with alpha-smooth muscle actin (αSMA) and mechanisms of mechanosensation, specifically with nuclear translocalization of Yes-associated protein (YAP) and lamin-A expression.*
Yong Hwee Tan et al.’s assessment of hASMC mechanosensation utilized an innovative hydrogel platform delivering a linear stiffness gradient to understand stiffness-mediated cell behavior with an ECM substrate for cellular adhesion. *
The employment of a stiffness gradient that was designed after empirical measurements performed on ex vivo ASM tissue, enabled the presentation of physiologically relevant stiffnesses to study hASMC behavior.*
Using this platform, the authors of the article found that hASMC mechanosense underlying mechanical cues more than the types of proteins they are anchored to by screening hASMC morphology, contractile phenotype, and mechanomarker expression, with a few exceptions.*
While the authors acknowledge that the findings from their study were done using cells from only one donor they still think that their study provides a proof of concept for the relevance of hASMC mechanosensation to ECM stiffness, and is another step in the right direction for understanding the pathophysiological impact of airway remodeling in obstructive diseases and exploring potential avenues for improving therapy through greater fidelity of in vitro platforms that include key concepts of mechanosensation. *
Yong Hwee Tan et al. wanted to use the same method which is used to assess hydrogel stiffness, namely atomic force microscopy (AFM), to measure ASM stiffness.*
However, nanoscale measurements of ASM strips by AFM proved to be difficult due to an uneven tissue surface after de-epithelialization (Figure S1C, Supporting Information of the cited article), resulting in false force triggering.
To validate the translation of stiffness values measured from macroscale compression (ASM strips) to nanoscale indentation (AFM on hydrogels), Yong Hwee Tan et al. fabricated additional hydrogels of four different stiffnesses using well-characterized polyacrylamide and compared the stiffness of hydrogels measured by uniaxial compression tester and atomic force microscopy (Figure S2A, Supporting Information of the cited article).
The nanoscale stiffness of hydrogels was assessed using an atomic force microscope (AFM) with NanoWorld triangular Pyrex-NitridePNP-TR AFM probes (the longer AFM cantilever beam – CB 2 – with 200 µm length was used).
These AFM tips probed hydrogels immersed in 1 × PBS with 2 nN, an approach velocity of 2 µm s−1 and a retraction velocity of 10 µm s−1.
Young’s modulus was determined from linear portions of contact-generated force curves using a custom-written code in Igor Pro.
All probe indentations were made in triplicate and averaged for a stiffness measurement in kilopascals (kPa).
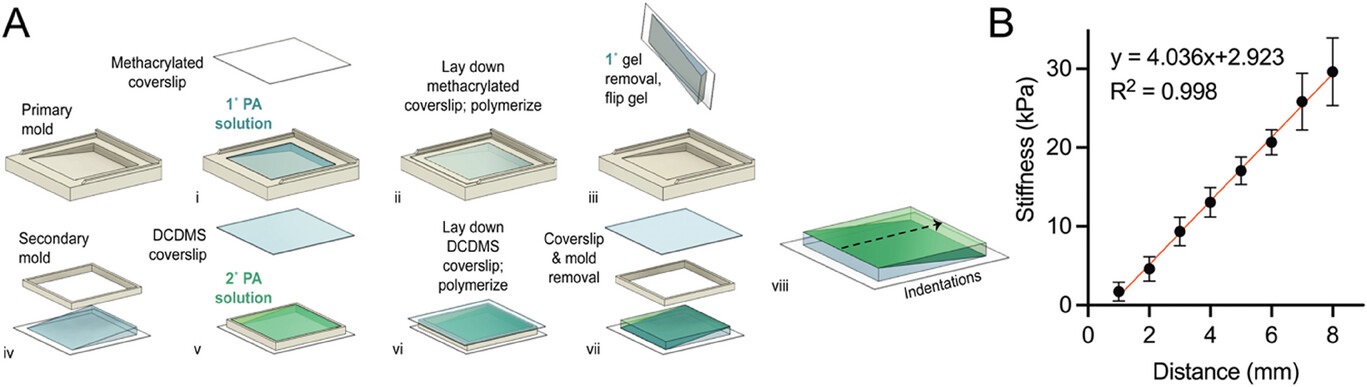
An example force curve is shown in Figure S2B, Supporting Information of the cited article. Validation of a linear stiffness gradient was achieved with eight indentations on the hydrogel, 2 mm away from both edges of the hydrogel and at 1 mm intervals along the stiffness gradient axis. Measurements were plotted against displacement from the hydrogel edge (soft to stiff) (Figure 2B of the cited article).
Figure 2 from Yong Hwee Tan et al. 2024 “Stiffness Mediated-Mechanosensation of Airway Smooth Muscle Cells on Linear Stiffness Gradient Hydrogels”: Linear stiffness gradient hydrogel fabrication. A) A schematic of a two-step polymerization process. i) 120 µL of mixed polyacrylamide (PA) solution (% acrylamide + % bis-acrylamide) was added to the primary mold and left to polymerize under ii) a methacrylated coverslip for 20 min. iii) Wedge-shaped 1° gel was removed and flipped for placement of a iv) secondary mold before v) addition of a second 120 µL PA solution and polymerized under a vi) dichlorodimethylsilane-coated coverslip for 20 min. vii) Removal of coverslip and mold completes the fabrication of bi-layered stiffness gradient hydrogel. viii) the dotted arrow indicating the direction of gradient and atomic force microscopy (AFM) measurement. B) Young’s moduli gradient measured by AFM. Twelve hydrogels were selected (one gel per batch) and assessed for stiffness, yielding a gradient of 4.0 kPa mm−1, with a range of 1.7 ± 1.2 to 29.6 ± 4.3 kPa (R2 = 0.998, n = 8). Data are presented as mean ± SD.
Figure S2 from Yong Hwee Tan et al. 2024 “Stiffness Mediated-Mechanosensation of Airway Smooth Muscle Cells on Linear Stiffness Gradient Hydrogels”: (A) Correlation of Young’s modulus from macroscale stiffness (UCT) assessment with nanoindentation (AFM), was conducted using cylindrical PA hydrogels of different Acrylamide %/Bis-acrylamide % derived from Tse and Engler [47] 10 %/0.06 %, 10 %/0.1 %, 10 %/0.15 % and 10 %/0.3 % (Linear regression, P < 0.0001, R2 = 0.9288, n = 4). Data are presented as mean SEM. (B) An example force curve from atomic force microscopy with an approach velocity of 2 μm/s, until a 2 nN trigger force was registered, and retraction of indenter at 10 μm/s.*Yong Hwee Tan, Kimberley C. W. Wang, Ian L. Chin, Rowan W. Sanderson, Jiayue Li, Brendan F. Kennedy, Peter B. Noble and Yu Suk Choi Stiffness Mediated-Mechanosensation of Airway Smooth Muscle Cells on Linear Stiffness Gradient Hydrogels
Advanced Healthcare Materials 2024, 2304254
DOI: https://doi.org/10.1002/adhm.202304254
The article “Stiffness Mediated-Mechanosensation of Airway Smooth Muscle Cells on Linear Stiffness Gradient Hydrogels” by Yong Hwee Tan, Kimberley C. W. Wang, Ian L. Chin, Rowan W. Sanderson, Jiayue Li, Brendan F. Kennedy, Peter B. Noble and Yu Suk Choi is licensed under a Creative Commons Attribution 4.0 International License, which permits use, sharing, adaptation, distribution and reproduction in any medium or format, as long as you give appropriate credit to the original author(s) and the source, provide a link to the Creative Commons license, and indicate if changes were made. The images or other third-party material in this article are included in the article’s Creative Commons license, unless indicated otherwise in a credit line to the material. If material is not included in the article’s Creative Commons license and your intended use is not permitted by statutory regulation or exceeds the permitted use, you will need to obtain permission directly from the copyright holder. To view a copy of this license, visit https://creativecommons.org/licenses/by/4.0/.

![Figure S2 from Yong Hwee Tan et al. 2024 “Stiffness Mediated-Mechanosensation of Airway Smooth Muscle Cells on Linear Stiffness Gradient Hydrogels”:(A) Correlation of Young’s modulus from macroscale stiffness (UCT) assessment with nanoindentation (AFM), was conducted using cylindrical PA hydrogels of different Acrylamide %/Bis-acrylamide % derived from Tse and Engler [47] 10 %/0.06 %, 10 %/0.1 %, 10 %/0.15 % and 10 %/0.3 % (Linear regression, P < 0.0001, R2 = 0.9288, n = 4). Data are presented as mean SEM. (B) An example force curve from atomic force microscopy with an approach velocity of 2 μm/s, until a 2 nN trigger force was registered, and retraction of indenter at 10 μm/s. NanoWorld triangular Pyrex-Nitride PNP-TR AFM probes were used to assess the stiffness of the hydrogels with atomic force microscopy.](https://www.nanoworld.com/blog/wp-content/uploads/2024/07/Fig-S2-from-Young-Hwee-Tan-2024-Stiffness-Mediated-Mechanosensation-of-Airway-Smooth-Muscle-Cells-on-Linear-Stiffness-Gradient-Hydrogels-NanoWorld-PNP-TR-AFM-probe.jpg)